Video marketing analytics
Analytics built for action
Track performance, optimize your videos, and drive real results.
Video heatmaps
See exactly which parts of your videos folks are watching, replaying, or skipping over.
A/B testing
Test two different thumbnails, videos, or versions of a video against each other to see which one resonates more with your audience.
Integrations
Connect Wistia to your marketing automation platform (MAP) to bring videos into your overall strategy.
Webinars
See who’s registering, who’s attending, and how engaged they are throughout your event.
Analytics at every level
Get top-down insights to maximize your ROI.
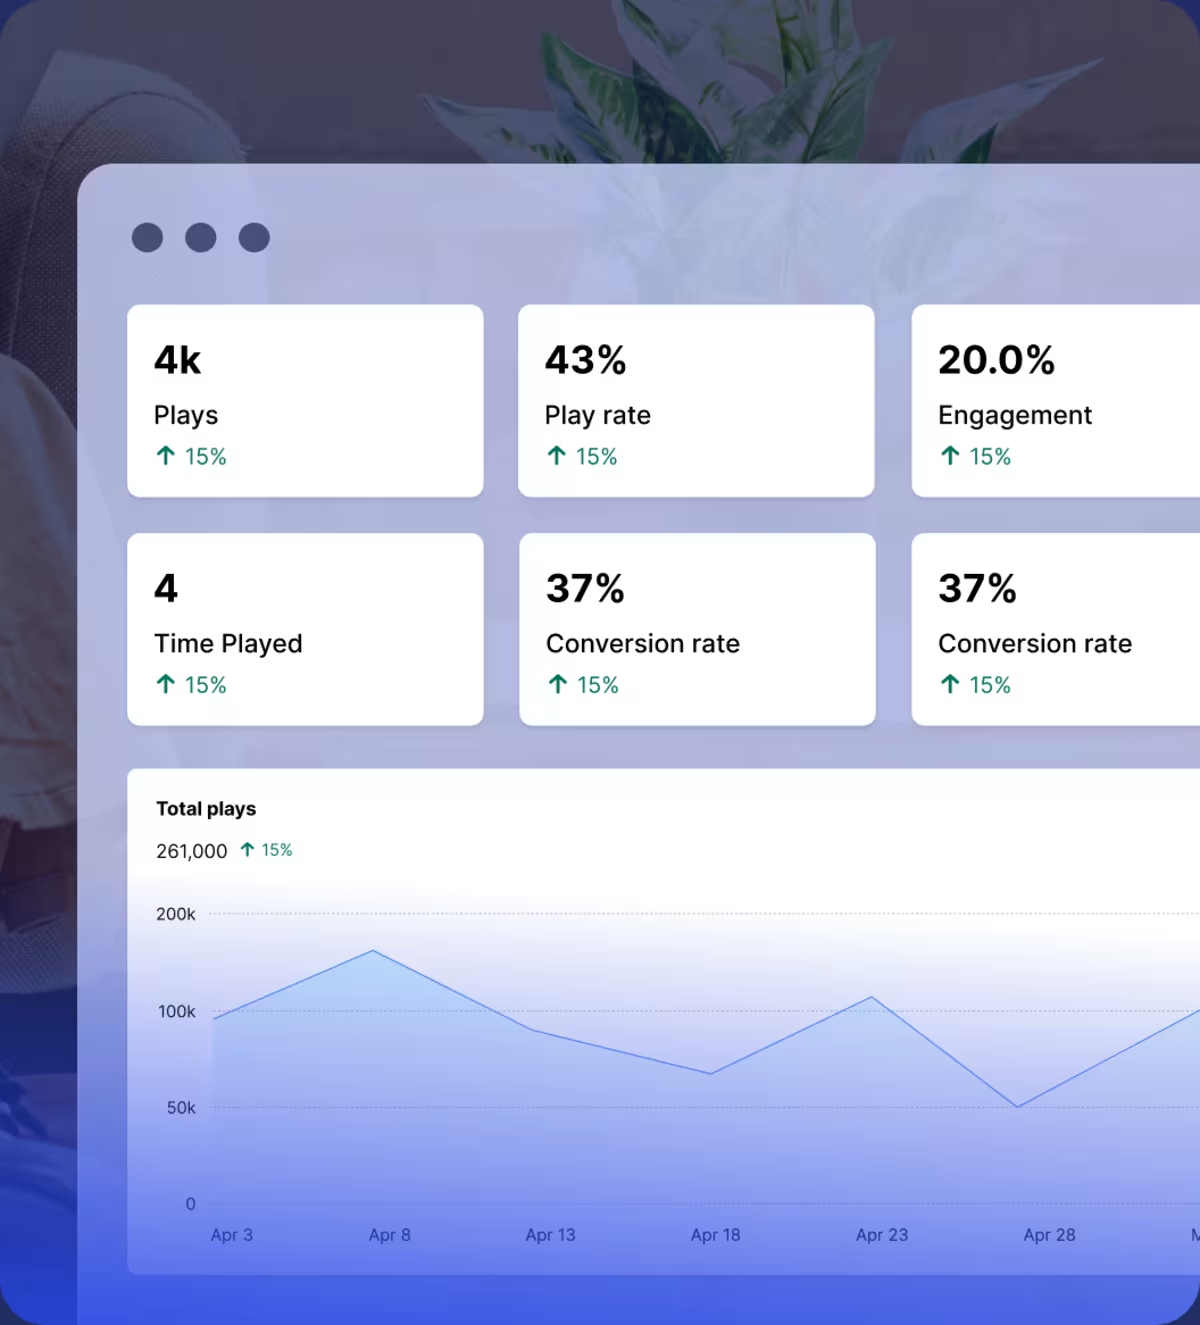
Account performance at a glance
Get a quick overview of your video library’s performance with key metrics like number of plays, visitor count, engagement rate, and conversion rate—all at your fingertips.
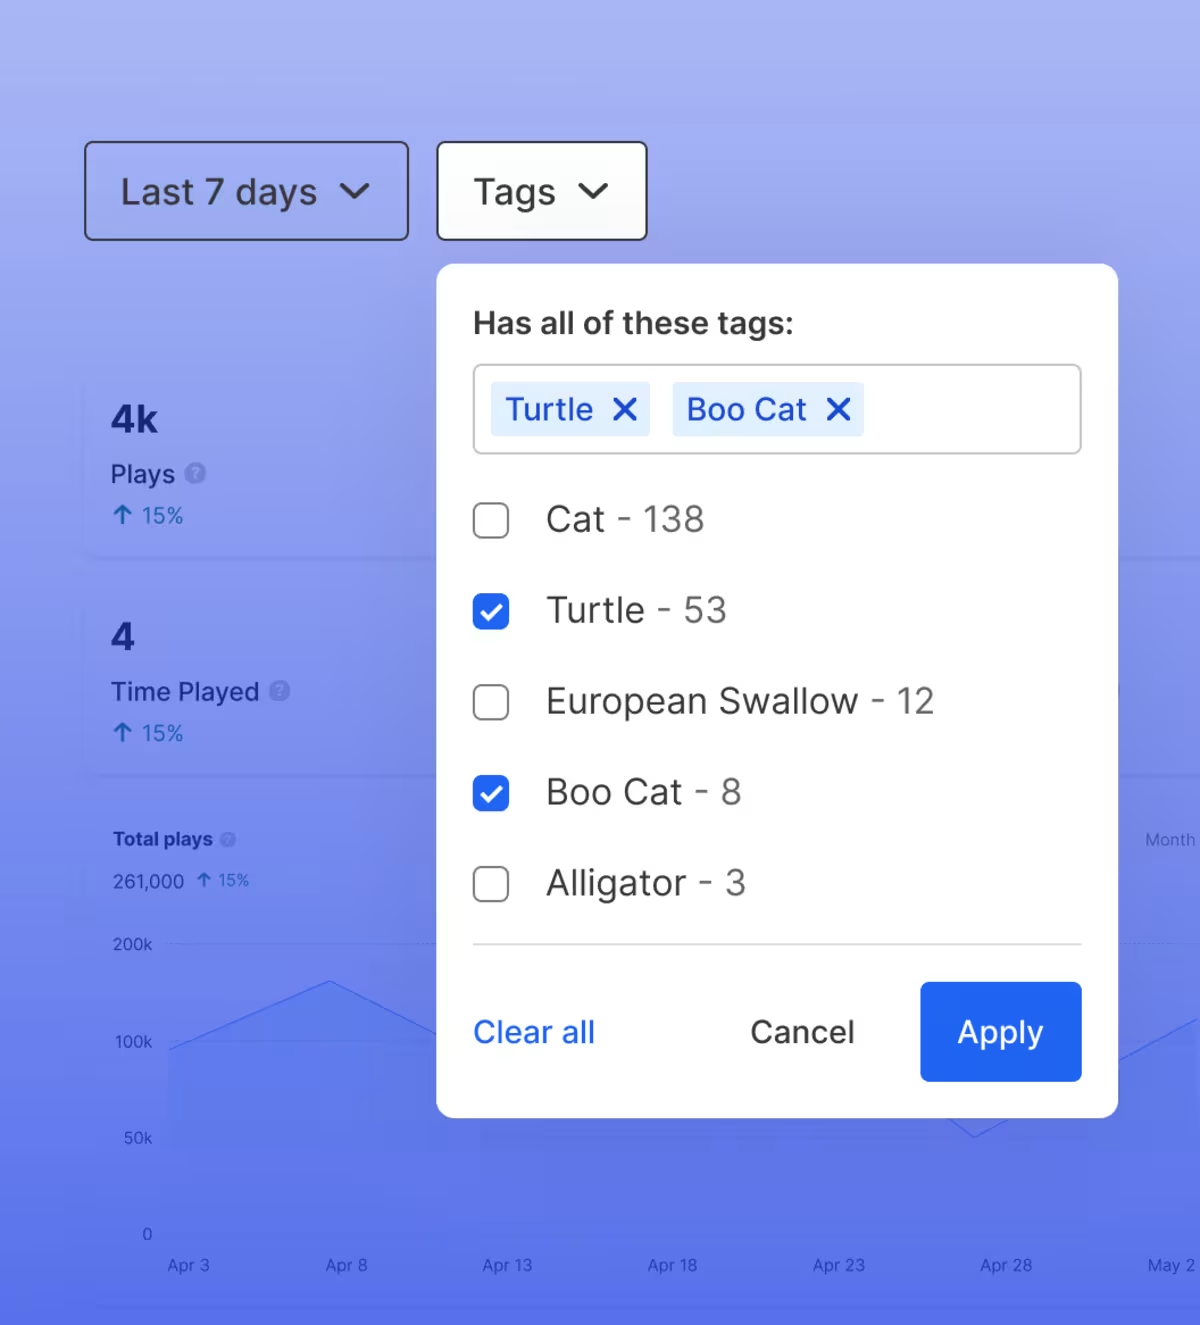
Performance by project
Understand how all the videos in your project perform. You can even filter by tags to see metrics for a specific group of videos.
Video-specific stats
Keep tabs on each piece of content.
Engagement metrics
Discover the most engaging parts of your video with second-by-second play and replay stats. Plus, get insights on total plays, play rate, and average engagement.

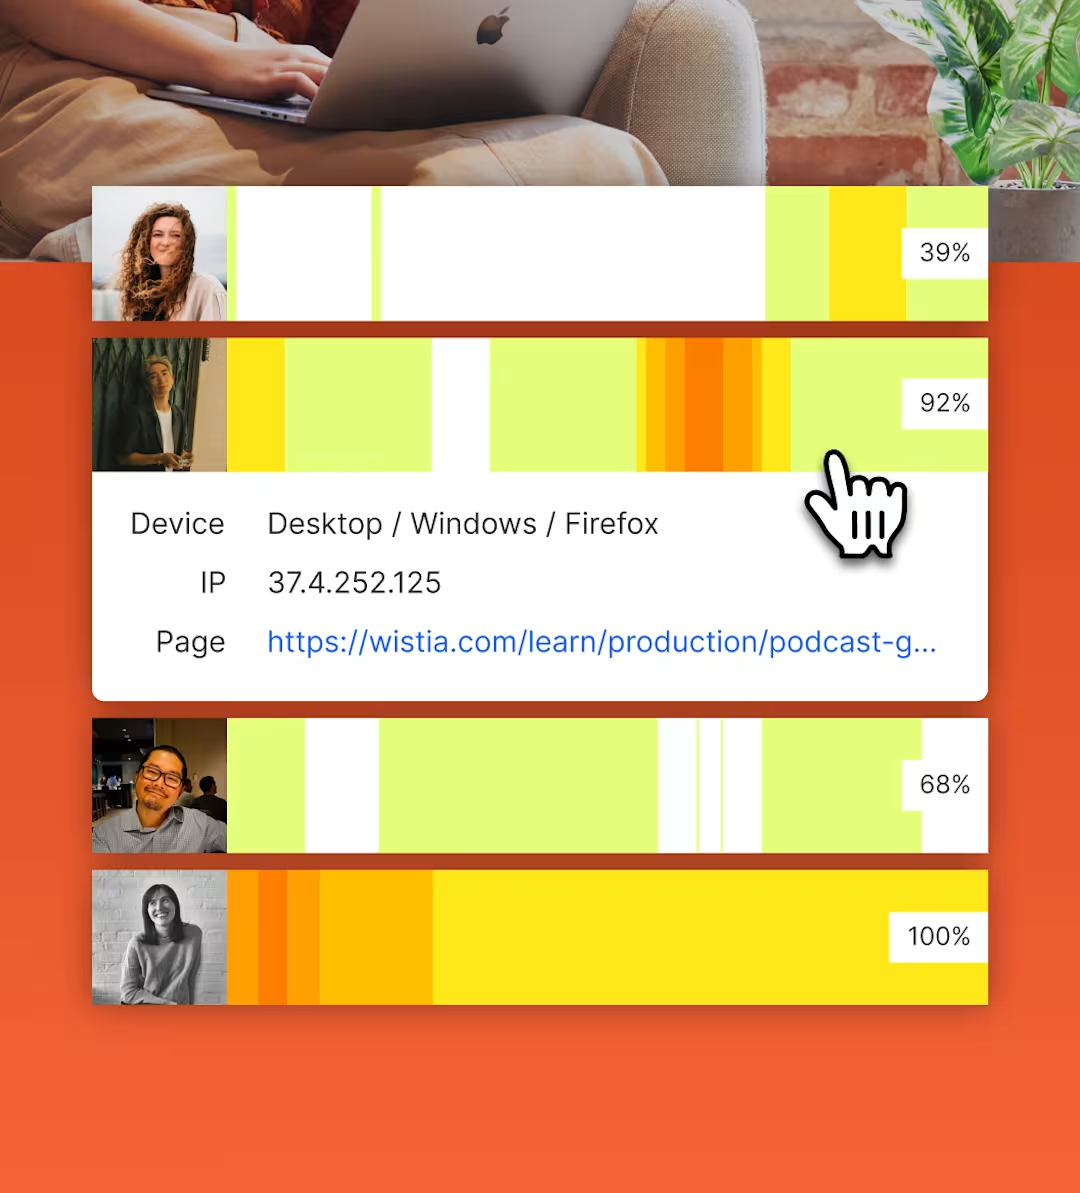
Video heatmaps
Know exactly which parts of your video each viewer watched, rewatched, and skipped. Our heatmaps also show you what device and web page they used to play your video.
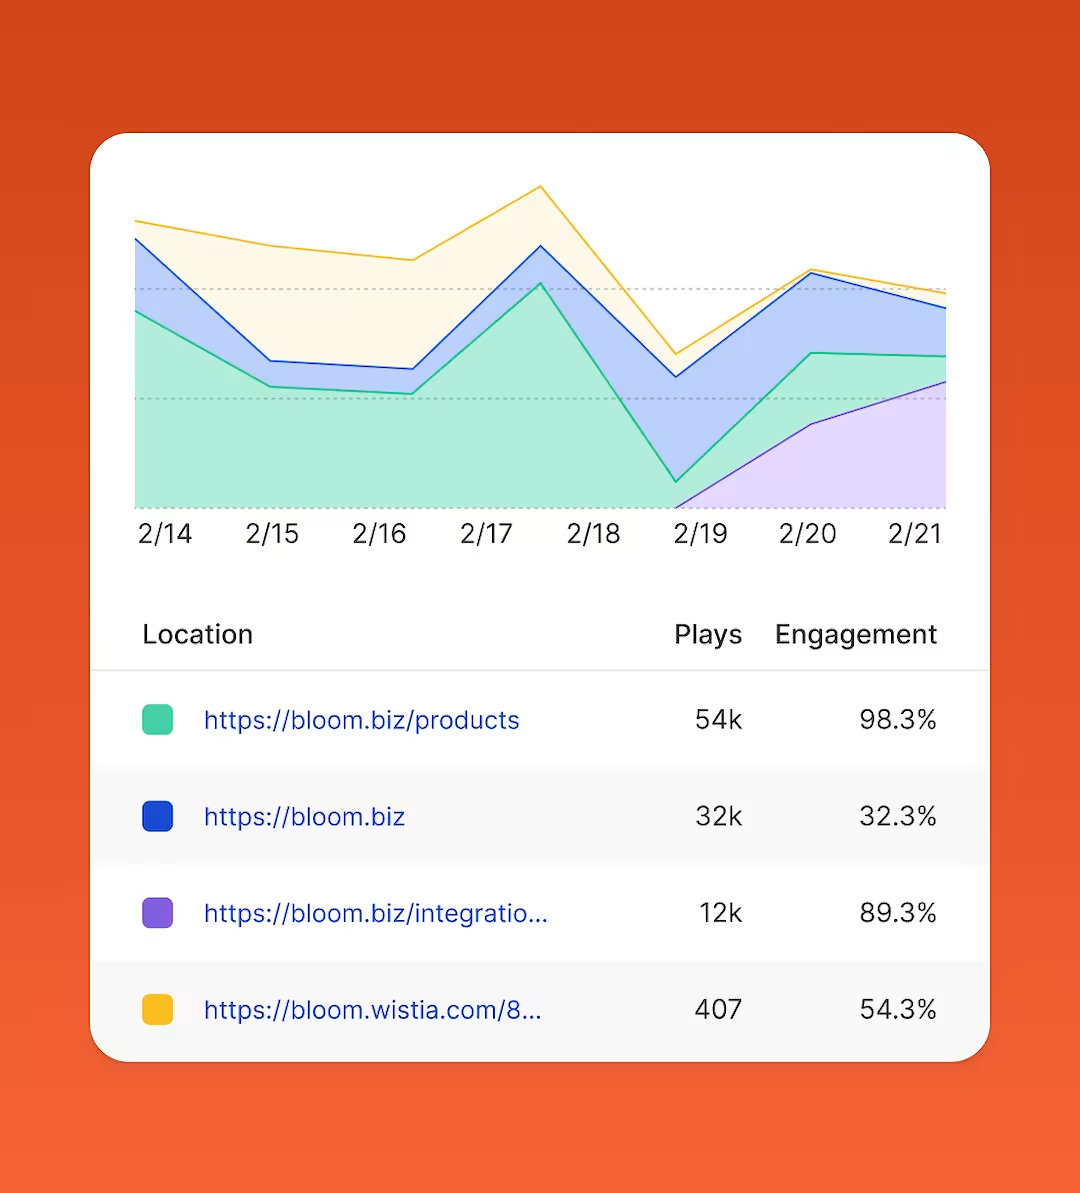
Track views
Publish your video in a bunch of places like product pages, blog posts, and emails. We’ll track its performance by embed location so you know where it gets the most visits, plays, and engagement.
Track traffic
See how your audience arrives at your video. And when you use UTM codes, we’ll show you how much traffic your video gets by campaign, source, and medium.
A/B testing
Optimize your videos’ impact on your business. Serve two thumbnails, videos, or versions of a video to your audience to see which one performs better.
Conversion rate
See if the calls to action, annotation links, and email capture forms in your videos are getting the job done. We’ll show you what percentage of viewers are taking that next step.
Like what you see?
Start a free trial3 ways to use data integrations
Boost your bottom line with our marketing automation platform integrations.
Learn more
1. Trigger workflows
Set up alerts that let your sales team know when someone watches a certain percentage of your video.
2. Build email lists
Add an email collector to your video and start capturing leads. We’ll send those email addresses to your MAP so you can easily add them to your nurture flows.
3. Improve sales calls
Give your sales reps the inside scoop before they jump on a call. Connect HubSpot or Pardot to your Wistia account so they can see individual viewing data on prospects’ contact cards.
“Wistia’s analytics give us deep insights into our customer journey. With Wistia, we get a big-picture view of which videos engage prospects and a detailed look at how they interact with each video, down to the specific sections they rewind or skip. Wistia helps us focus our efforts on what matters most.”
M. Tre Gonzalez Director of Growth at OnCourse Systems for Education

Choosing between Wistia & Vimeo?
See how they stack up on the stuff that really matters, like branding, analytics, integrations, and more.
Read on
Webinar analytics, coming right up
All that sweet video data? We’ve got it for your virtual events, too.
Learn more
Funnel metrics
Stats like impressions, registrants, attendees, and engagement show you how successful your webinar really is.
Attendee analytics
Personalize and automate post-webinar outreach with attendee-specific data that flows right into your marketing platform. Think: who’s tuning in, when they’re engaged, how many times they’re active in the chat, and when they drop off.
Video analytics are just the beginning
We’ve got all the tools you need to squeeze more juice out of your videos.

Recording
Create super polished videos with just your laptop.
Editing
Zhuzhing up your videos has never been easier.
Collaboration
We’ve made getting feedback simple and fun. Really!
Management
Store, organize, find, and archive your videos in a jiffy.
Playback
We designed our player to be fast, customizable, and compatible with any browser or device.
Embedding
Copy and paste our embed code onto your page for reliable playback on any device.
Video galleries
Build an on-brand page for all your content. No coding required.
Lead generation
Turn your videos into marketing machines.
Podcasting
Upload your pod and we’ll distribute it to top directories like Apple and Spotify.
Wistia API
Build custom video experiences for your site.
Frequently asked questions
Get all the As to your FAQs.
What are video analytics?
Video analytics are a set of key metrics that give you a complete view of how your audience is engaging with your videos. They provide valuable insights like total visits, videos watched, engagement metrics per video, traffic source, total plays, total watch time, play rate, and insights about where your videos are embedded.
What are the benefits of video analytics?
Video analytics are the most effective tools for measuring video performance and validating your video marketing strategy, which—let’s face it—isn’t always easy!
By analyzing data, you can understand which video content resonates with your audience, which channels are most effective, and how different viewers engage with your videos. Using this information, you can improve your video marketing efforts and create content your target audience will love.
Why do I need analytics for my videos?
You need video analytics to (1) better understand your overall video performance and (2) gain insights about where your audience is most—or least—engaged with your content. It’s also important for you to understand whether your video strategy is effective and is generating leads so you can better plan for future videos.
Where do video marketing metrics come from?
Video marketing metrics come from various places, such as the page where the video is embedded, the channel where the video is shared, the device on which the video is viewed, and even the campaign with which the video is associated. Users can use these metrics to determine if their videos generate leads.
When viewed altogether, video marketing metrics allow you to get a deeper understanding of the engagement level for each viewer, going beyond just the number of views to reveal how engaged they are with your brand across all of your content.
What video metrics matter most for your program?
We hate to say “it depends,” but it’s kind of true. Each metric plays a role in understanding different aspects of video performance.
The play rate can indicate how well your video’s thumbnail is performing or whether you have your video embedded or distributed in the right places. The number of plays helps you understand your video’s reach or popularity. Average engagement and individual viewer heatmaps show how your video content is received and whether your entire video is engaging. Traffic sources can help you gauge the success of your video campaigns. Your conversion rate will show you what percentage of viewers followed a call to action (CTA) or filled out an in-video lead capture form.
All of these metrics paint a picture of your video performance, and what matters most depends on what you want to accomplish with your video marketing efforts.
Which metrics should you monitor?
You should monitor the video metrics that most align with your goals. When it comes to explainer videos or how-to videos, the average engagement will let you know whether your video resonates with your audience. If you’re creating a product demo, the conversion rate might be more important to monitor because the primary goal is to generate leads. Think about what you want to accomplish with your video content and then determine which metrics matter most for those individual videos.