
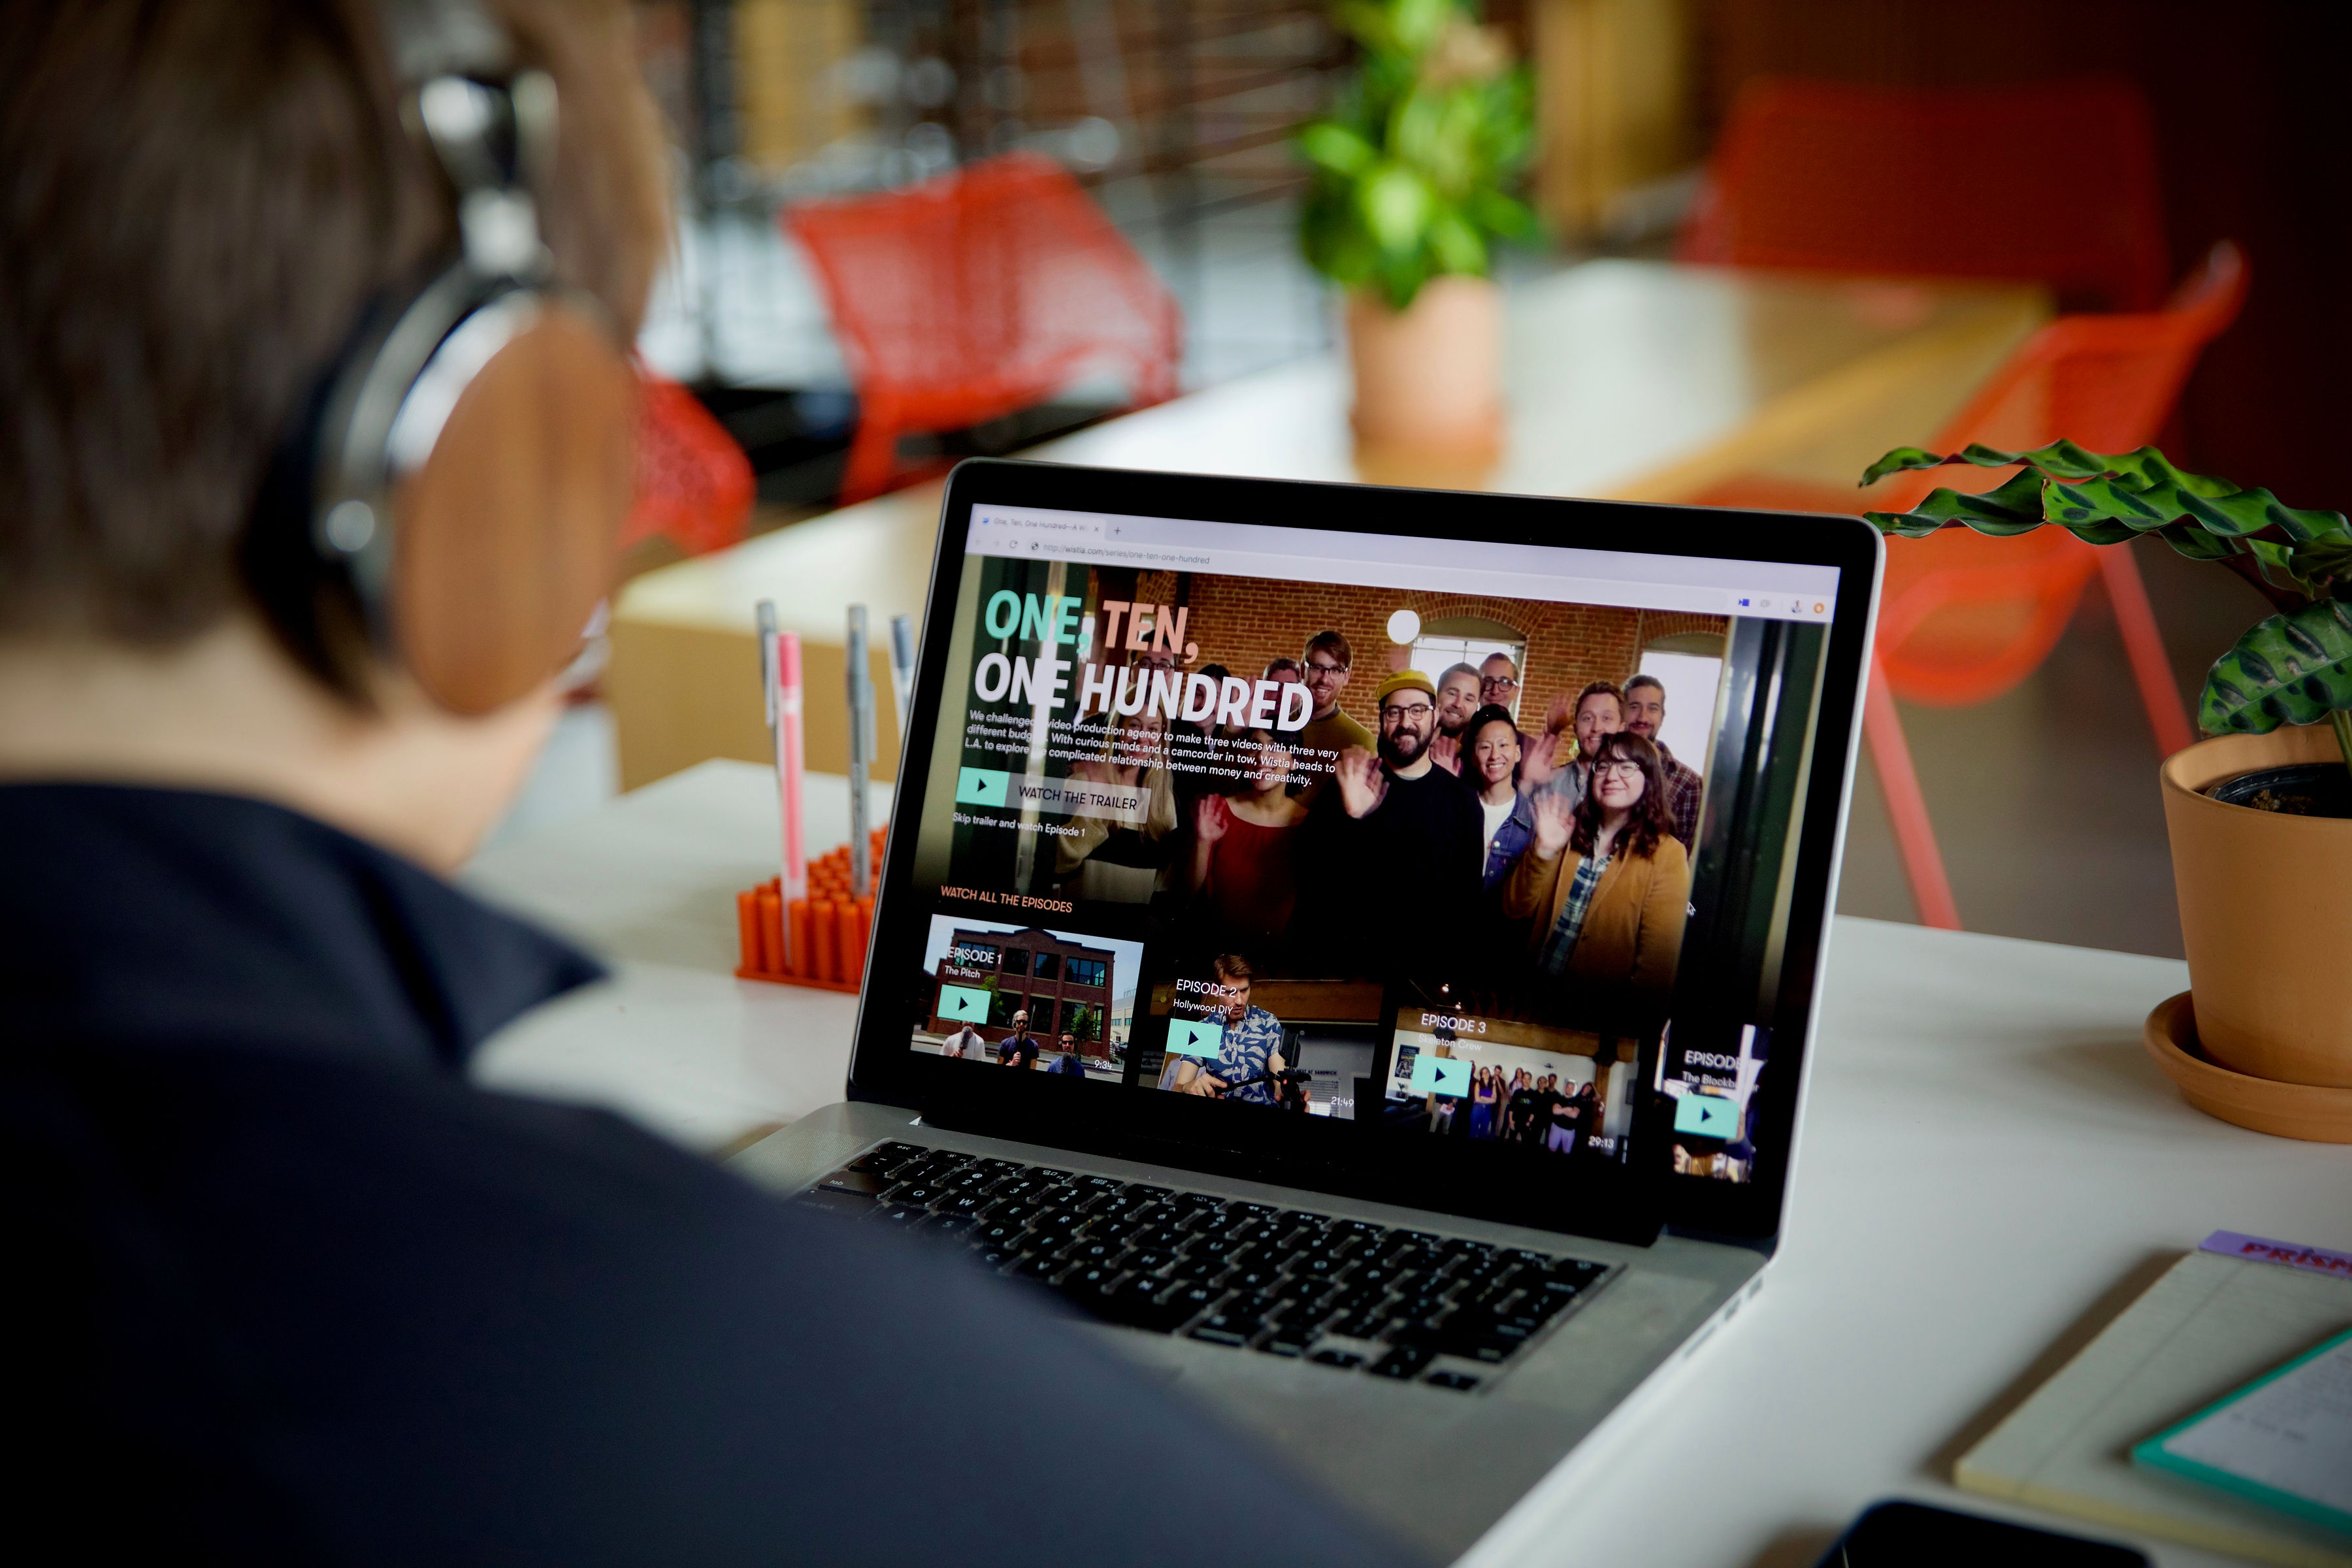
Recently, we’ve had a lot of news to share here at Wistia. Between launching our first video docuseries, One, Ten, One Hundred and announcing its availability for streaming on Amazon, there’s been no shortage of exciting news.
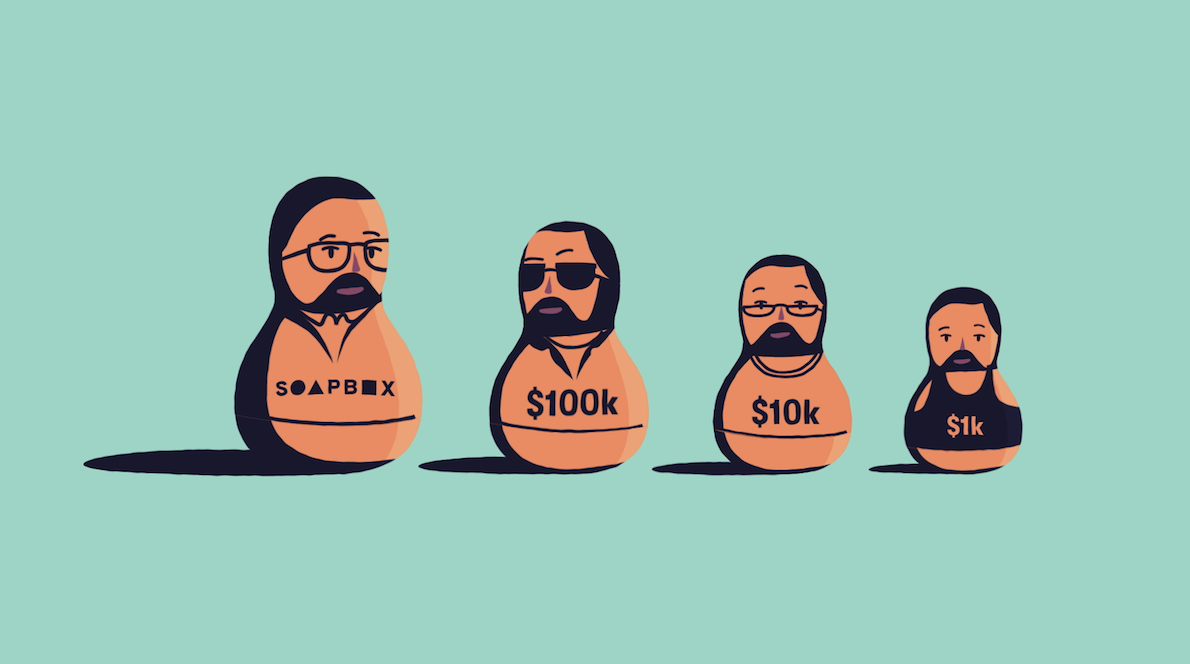
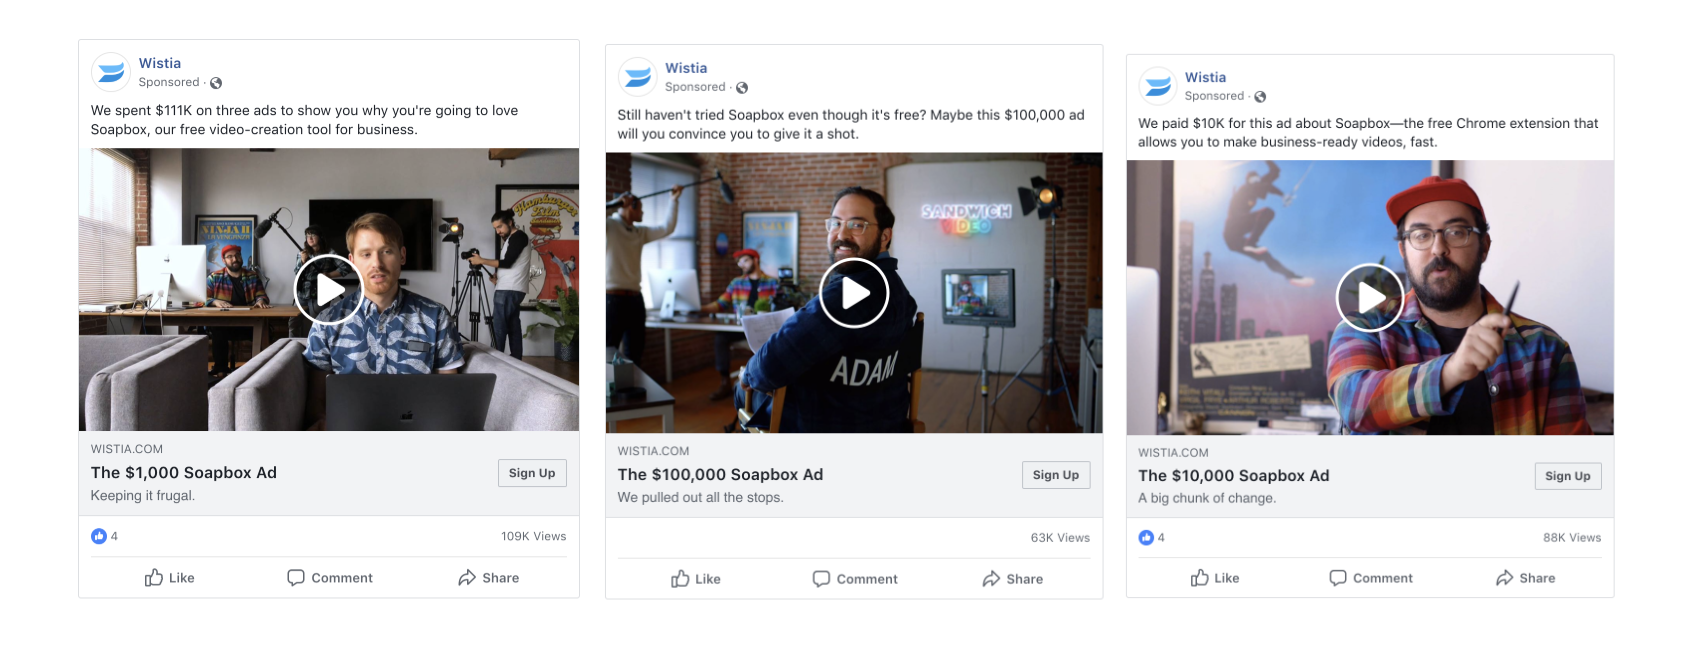
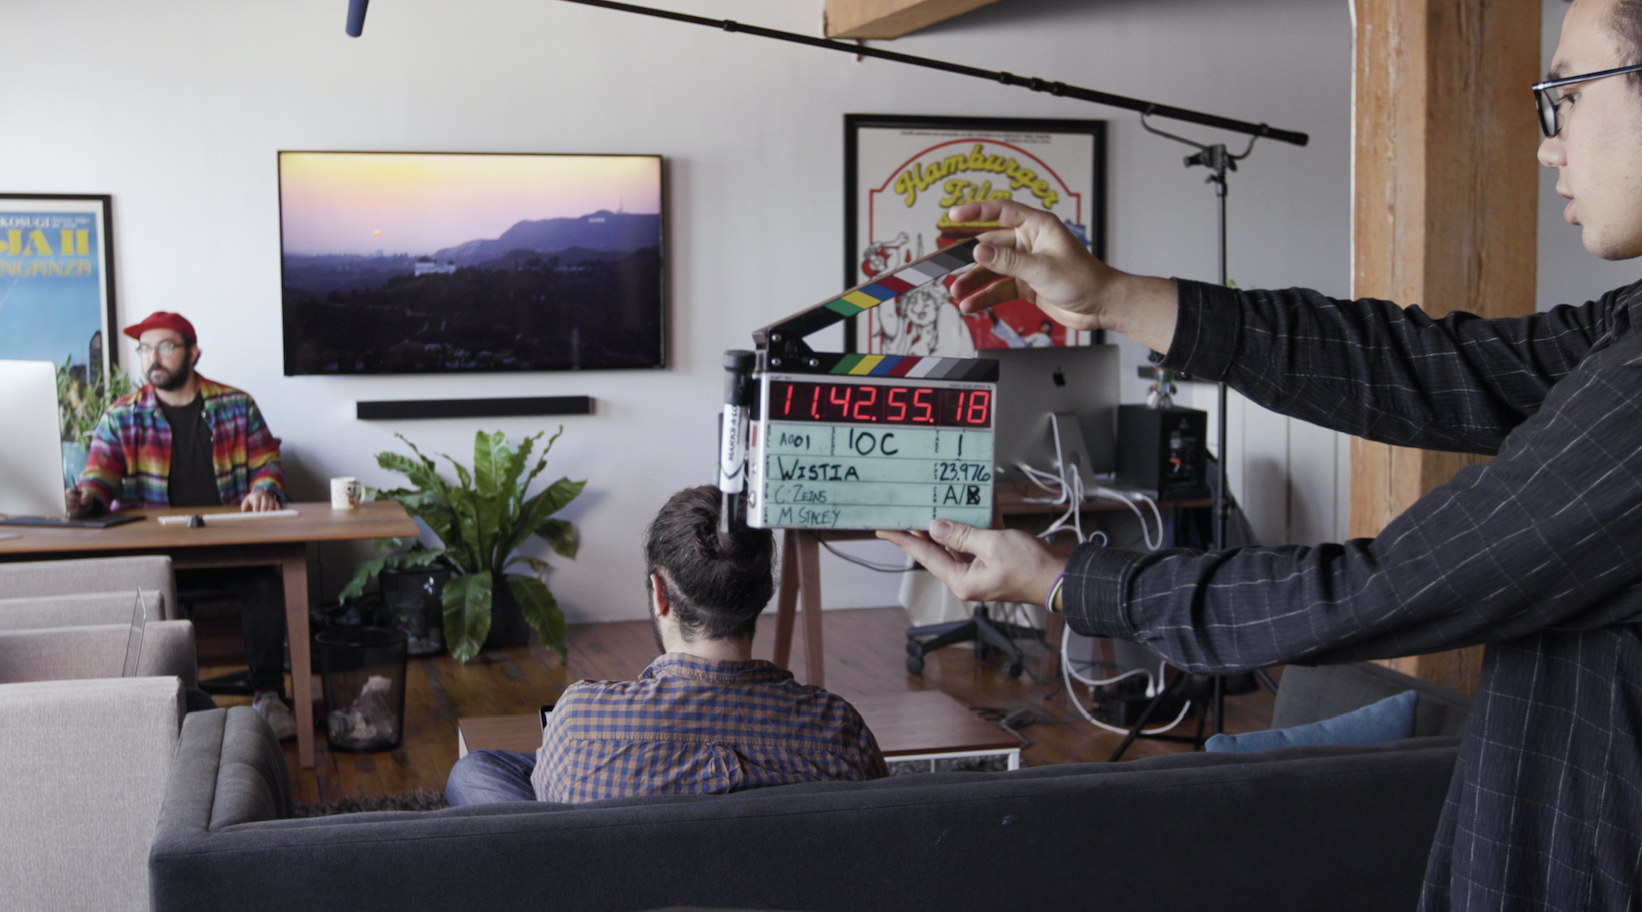
By now you hopefully know about One, Ten, One Hundred, but for those of you who don’t, Wistia worked with Sandwich Video to come up with a creative concept and produce three video ads to promote our video recorder with a production budget of $1k, $10k and $100k. Wistia’s video team then shot behind-the-scenes coverage and made it into a four-part video docuseries. The goal of the project was to explore the complicated relationship between creativity and money.
We've been talking a lot about the creative side of the project, and how much budget can impact video production, but you haven’t heard much about what we actually did with the video ads that promoted Soapbox, our free webcam and screen-recording tool. That’s because we've been busy running an experimental advertising campaign that used all three video ads—and we're excited to finally share the results!

Does production quality matter in advertising?
We just released an extensive report called "Does Production Quality Matter in Advertising" that includes our methodology and results, along with actionable insights to use in your next ad campaign. As a marketer, I crave this kind of transparency from companies. Very rarely do I find such detailed results when searching for case studies or benchmarks. So, if you're anything like me, I highly encourage you to find yourself a comfy seat and read the full report! Oh, and make sure you bookmark it (and share it with co-workers, nudge-nudge!), because there are a lot of juicy results in there worth sharing.
But, let’s take a step back. You may be thinking "That’s great and all, but what did you actually do to end up with those results?" At the end of the day, we had three amazing video ads to work with. We wanted to use the video ads to actually drive awareness and installs for Soapbox, and were also super eager to see how each ad performed against one another.
Wistia took a huge risk even just producing the video ads (we spent $111,000 to do so!), so the pressure was on to come up with a well-thought out, strategic media plan that would produce revenue-driving results for Wistia. With this media plan we wanted to achieve three things:
- Generate awareness of Soapbox as the best and simplest video presentation tool, and establish Soapbox as a product leader.
- Capture demand for Soapbox through installs of the Chrome extension.
- Learn from the media in-market and use those learnings to create content and share with other marketers.
Setting the campaign goals
Before we could start building the media plan, the first step was to set our goals. We had never done something like this before, but we knew the goals needed to be based on a desired end result, and also give us an indication of interest in Soapbox. We wanted to keep it simple, so we chose a primary and secondary KPI. These KPIs, or key performance indicators, would ultimately help us evaluate the performance of the video ads, and media partners.
- Cost Per Install
- Cost Per 25% Watched
For the primary KPI, we chose a metric that was closely tied to our revenue, which was Cost Per Install. That being said, Soapbox installs and CPIs were only a piece of the puzzle. Being a video company with an eye on video metrics, we wanted to know if users were engaged with the video content as well. For us, we defined engagement as 25% watched, and used cost per 25% watched as a proxy for a meaningful brand impression. Whenever there was a question on messaging, ad formats, targeting, or budget, we always went back to the KPIs to be our guiding light in the decision-making process.
“Whenever there was a question on messaging, ad formats, targeting, or budget, we always went back to the KPIs to be our guiding light in the decision-making process.”
One piece of advice after running these campaigns? Try not to fall victim to data overload. We know from experience that it can be easy to get lost in the plethora of data available in digital marketing. There are metrics available in the media platforms themselves like Facebook and Adwords, there's also Google Analytics for tracking all sources, and you likely have your own internal database for tracking incoming visits and actions taken on your site and in your product.
So, what did we choose? For this campaign, we chose a combination tools which included the media platforms themselves for real-time optimizations, and our internal database to track all sources and activities down funnel.
Evaluating the media partners
When putting together the media plan, we looked at the goals, and built a media plan to best achieve those goals. At the highest level, we wanted to generate interest in Soapbox and acquire new customers (installs of the Soapbox Chrome extension). At the end of the day, we wanted to answer this question...
“If we ran the video ads with 3 very different production budgets in a head-to-head test, which video ad would be the most effective (and efficient) at driving product installs and engagement?”
In order to do this, we turned to Facebook and YouTube as our primary paid media partners. Utilizing these partners made it possible for us to test at scale, and also provided us with the flexibility to allocate budgets and optimize in real-time. The campaign duration was only 3-weeks (a short campaign in the world of digital media), so we needed an to keep an eye on the data daily and shift budgets to the volume-driving placements and ad formats. To sum up our media strategy, we decided to…
- Allocate the majority of the budget to Facebook for reach at scale and put the remaining budget on YouTube, optimizing throughout the campaign flight for peak performance
- Leverage targeting technology to reach relevant audiences through lookalike, engagement, and contextual targeting
- Use this as a testing vehicle for promoting each video, as standalone ads, and as carousel and sequential ads on Facebook
We worked with a total test budget of $60,000 to run over a 3-week period. We also knew we needed a plan that would meet our campaign goals and drive enough impressions, views, and engagement metrics to actually learn from in the process. With so many ad formats and targeting options now available, how did we choose ad combinations that best supported our goals? Well, luckily there was a method to our madness, so let's dig into the nitty gritty details of the media plan itself, starting with the ad formats and the targeting!
Choosing the ad type
When evaluating the ad types on Facebook and YouTube, we kept going back to the creative itself—we wanted to make sure that the ad formats we chose were best suited for the video themselves. We felt it was also important that we had the ability to tell the story a bit with each ad, so we also looked at formats that provided us with additional copy for more context.
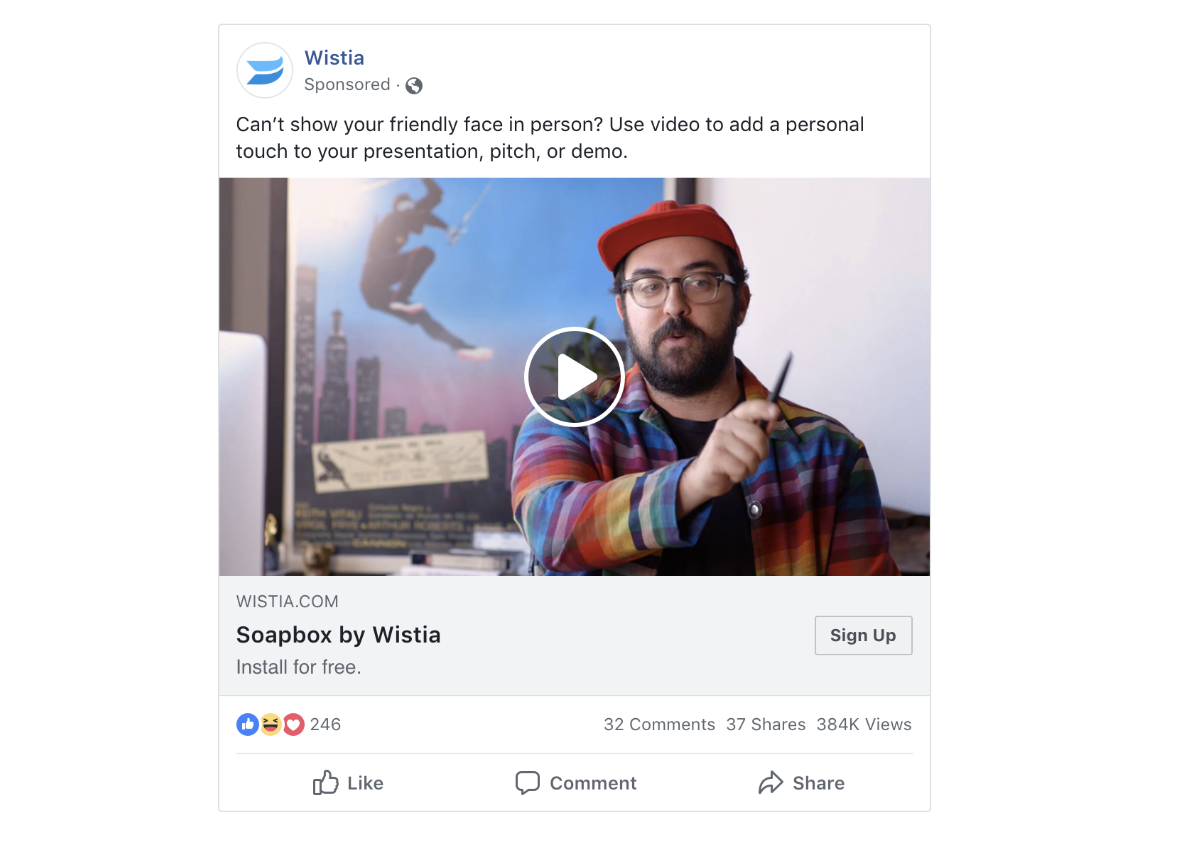
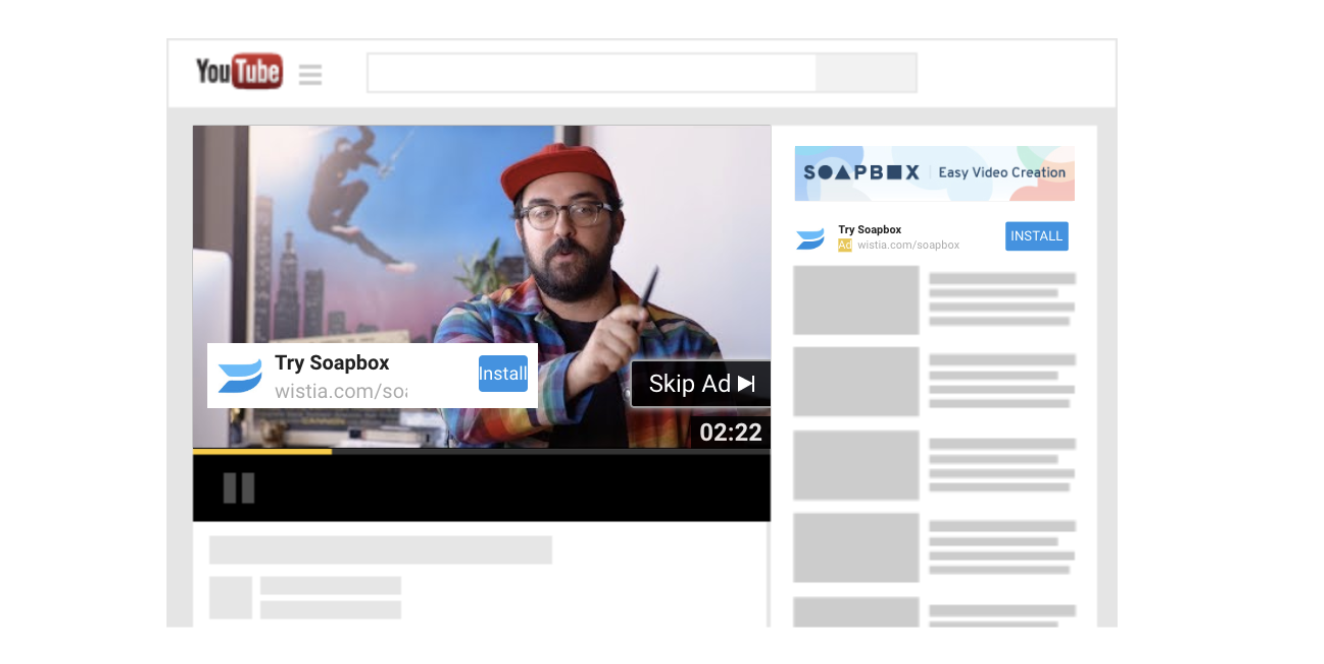
Direct Response Single Video Ads
In order to limit the testing variables, the copy used to support each video was kept the same, knowing that if we changed the copy, we would never know if the test result was because of the copy or the video. On both Facebook and YouTube, we ran identical copy to support all three video ads, with the CTA (call to action) being “Sign Up” on Facebook and “Install” on YouTube.
Running the videos head-to-head in this way gave us the opportunity to set up a simple test, keeping budgets, ad copy, and targeting all the same. By doing this, we knew that we would have the most insightful (and cleanest test data) to evaluate the performance.
YouTube
Sequential Advertising
Now, since we had a straightforward test set up, we also wanted to look into other types of targeting and ad formats to mix things up a little. Even though the primary KPI was Cost Per Install, we wanted to learn from this experience and share those insights with our audience on other content properties (like this!).
We experimented with sequential advertising on Facebook, with a reach and frequency objective. This allowed us to deliver the three ads consecutively based on engagement. Those who engaged with the $1K version then got served the $10K version. And those who watch the $10K version got to see the $100K version.
To keep our viewer's attention throughout the entire ad sequence, the copy in each ad hinted at the fact that there was a larger campaign at play. For example, the Facebook headline and description supported each video, but the text copy above the video referenced the larger production budget at stake, ie. "We spent $111k on three ads to show you why you're going to love Soapbox, our free video creation tool for business."
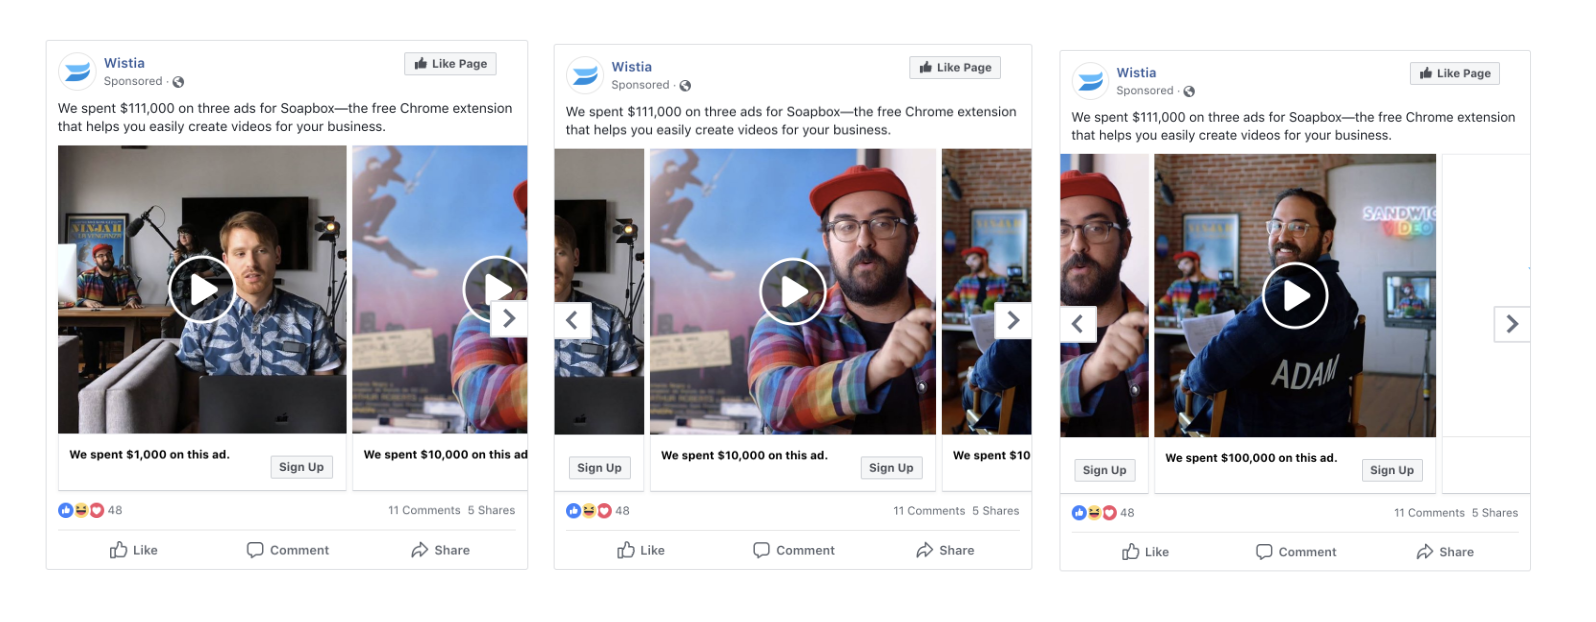
Video Carousel
To keep testing on Facebook, we decided to also use the Facebook Video Carousel ad format to display the three video ads in a row. We had seen success in the past when using single image carousel ads to drive engagement and conversions, but we had never tried running a video in a carousel ad. Most companies use this format to tell a linear story with three, simple, short ads. But few had created three standalone ads for the same product that all work together to tell a more complex narrative—so we were eager to be one of the few!
Reaching the right audience
If your ad targeting isn't tailored to a specific audience, then you're basically just throwing perfectly good creative (and money!) out the door—and who wants that? Knowing your audience and the targeting capabilities of the media platforms you're displaying ads on is crucial to the success of your campaign. Facebook and YouTube offer a multitude of ways to target distinct prospects using customer matches (or lookalike targeting) contextual and interest-based targeting.
“Knowing your audience and the targeting capabilities of the media platforms you're displaying ads on is crucial to the success of your campaign.”
There are pros and cons to each media platform when it comes to targeting, so it's rare that you'll apply the same formula on each platform. For example, since you need to be logged into Facebook to view your newsfeed, their ability to target audiences based on their profile is really strong. This also helps fuel lookalike targeting based off custom audiences you create. We pulled a customer list for people with the words "sales" and "marketing" in their titles, uploaded the list into Facebook, and then Facebook created a list of people who "looked like" the customers we were trying to reach, while suppressing those who are actual customers.
Another targeting method we used in this campaign was engagement audience. This is when you target users who have engaged with an ad from another campaign. In our case, we wanted to target those who have watched >75% of another Wistia video on Facebook. Since most people go to Facebook to check out their newsfeed and catch up on their friends' activities, Facebook can be considered a somewhat passive channel. So, when users engage with your brand by watching more than 75% of another video of yours, it’s a strong indication that they're interested and want to learn more!
This may seem complicated, but our targeting boiled down to the following:
- Lookalike audience based on a customer match
- Engagement audience targeting those who watched >75% of another video
YouTube
Luckily, when it comes to targeting on YouTube, you already have a captive audience who expects to consume video (whether it's on their own terms by searching, or as pre-roll or mid-roll video ads). YouTube has lots of great targeting options that pull in search and browsing behaviors on and off the YouTube platform that can be used for targeting video ads.
In this case, we used targeting that captured in-market shopper interest, custom intent based on terms users have previously searched for in Google, topical targeting, and remarketing based on viewing behavior on certain videos or video interactions. This coupled with YouTube's TrueView for Action ad functionality (which forces users to watch at least 5 seconds of the video, and only charges you if a users watches at least 30 seconds) made for a winning combination in this campaign. To sum up the targeting on YouTube, we used 4 different types to reach relevant sales and marketing professionals.
- In-market: Advertising, marketing series and/or video software
- Custom intent: Based on terms users have previously searched for in Google
- Topics: Marketing, sales, video software
- Remarketing: Viewed certain videos and video interactions on YouTube
Keeping an eye on the data
Throughout our three-week campaign, we optimized on a weekly (and sometimes daily) basis, shifting dollars between Facebook and YouTube. As a marketer, you wouldn't be doing your job if the media plan you started with was the one you ended up with. So, even though we decided to allocate a majority of the budget to Facebook and a small portion of it to YouTube, it became clear early on that while Facebook was driving volume, but less efficiently compared to YouTube.
“As a marketer, you wouldn't be doing your job if the media plan you started with was the one you ended up with.”
Instead of completely pausing Facebook, we decided to dial back the spend and focus our dollars on the top performing ads on Facebook, and then turned up the spend on the top performing YouTube placements. We wanted to make sure we included both of these media partners as part of the marketing mix in order to capture prospect's attention at different points throughout their buyer’s journey. Having some overlap between two media platforms is actually a good thing, as it leads to more brand touch points and further re-enforces the brand with prospects for future recognition!
So, at the end of the day (and campaign), how did the ads perform? Do businesses need to spend $100k on a video ad, or is $1k enough to get the job done? Or, is it actually somewhere in between?
Which video ad performed the best?
Across the board, the video we created for $10K performed the best based on our goals. To do this, we circled back to our KPIs (key performance indicators) to evaluate the success of the video ads across the media partners and ad types.
Cost Per Install
I mentioned earlier that our primary KPI was Cost Per Install. In the spirit of full transparency, we had a target Cost Per Install goal of $8. Since we had never run a video ad longer than 45 seconds (this video ad was a full 2 minutes long!), we didn't know how people would respond. The $8 cost per install was admittedly a bit arbitrary and based on previous direct-response focused campaigns.
So, how did we do against our goal? Here are the results:
- YouTube was the most efficient media partner, coming in at a $11 CPI. The average watch time was also longer at 25 seconds vs Facebook at 8 seconds. This wasn’t surprising given that people are on YouTube to consume video, and may be more receptive to watching video ads.
- Facebook provided product install volume as well as valuable learnings about long-form video ads, however it didn't come close to our $8 CPI goal—it clocked in at a $40 CPI. The sequential ad, which was effective in driving impressions and views, failed at capturing product installs. The CPI for this ad format was $281, which brought up the overall cost per install. We actually wound up pausing sequential advertising halfway through the media flight to focus more on the efficient volume drivers.
- The most efficient ad on YouTube and Facebook was the direct-response focused $10k video ad, which had a CPI of $7 and $24 respectively. This was around half the cost per install that the other ads ($1k and $100k) had on Facebook and YouTube.
Cost Per 25% Watched
Heading into this campaign, I searched around to find cost per view metrics from other advertisers who have run similar video ads. I found a wide array of metrics depending on the industry, ad format, creative, targeting—there were so many variables to consider, which made it nearly impossible to use industry-wide data as our benchmarks.
What's the next best thing to use as comparison? Well, if you've been running Facebook or YouTube ads for a while (or even for a few short months), you'll likely have some performance data you can use to compare your campaign against.
For this campaign, we used historical data from previous video ads to see if the cost per 25% viewed was...well, "good!" Since we had never run a 2 minute video ad, we had to look at the "video played to 50%" metric for the 1 minute video ads we had run previously. For this, we were now comparing 30 seconds watched on a 2 minute video, and 30 seconds watched on a 1 minute video. On Facebook, this turned out to be $1.08, and for YouTube it was $0.10.
Let’s see how the campaign stacked up:
- On Facebook, the $10k video ad recorded a cost per 25% watched of $0.65. As you can imagine, we were excited to see that this campaign achieved a cost per engaged view that was 40% less than our own benchmark!
- On YouTube, the $10k video ad recorded a cost per 25% watched of $0.37, which was higher than our historical benchmark. However, over 20% of users watched at least one-fourth of the video, so we were still pretty happy to see that level of interest. If we want to run more longer form video ads, now we have a new benchmark to work with.
Even though some of our metrics fell short of our goals, it was important for us to look at the big picture and understand each media partner's performance. It’s tempting to compare Facebook and YouTube against each other, but there can (and should be) a place in your media plan that includes both. Each serves a different purpose and should be evaluated against their own set of KPIs.
“It’s tempting to compare Facebook and YouTube against each other, but there can (and should be) a place in your media plan that includes both.”
Wrapping it all up
At the end of the day, we achieved all the objectives we set out to at the beginning of this campaign! We generated awareness of Soapbox, drove product installs, and came up with a bunch of learnings that we could apply to future campaigns (and also share with you all).
As a marketer, that last point is one that sticks with me the most. Naturally, I want the ad campaigns to drive awareness and conversions, but the learning and sharing aspect of running campaigns like this is what I find the most fulfilling! This was a complex campaign with various ad creative, ad types, and targeting, and it could have ended up being a headache if I hadn’t set a clear campaign strategy and media planning process right from the start. Doing so actually made this a fairly simple campaign to evaluate, execute, and share results on.