

So the adage goes, you get what you measure.
And if you don’t measure your investment in video marketing properly (and if you don't tap into the power of comprehensive video analytics), very quickly it’s going to look like a bad use of time and money, which means you'll stop investing.
I think the reason why many companies are underinvesting in video is because they are treating the wrong video metrics as KPIs, and thereby under-reporting on the value video is providing. B2B companies typically measure videos exclusively in terms of their contribution to conversions. And B2C companies typically measure ROI of video in exclusively in terms views and impressions.
Both have big problems.x

Error 1: Measuring only conversions
Conversion-based measurement is an attempt to put a meaningful monetary figure on the value received from the video, such that one can calculate “ROI” by comparing cost and return. This involves measuring how much a video contributes to the bottom line, based on a position in a funnel—simply put, trying to work out how many people ended up purchasing your product or service after watching your video.
The least sophisticated method of doing this is to track how many people watch a video and then take the next measurable step towards purchase within the same session. More sophisticated methods track the same user over multiple sessions and channels, using cookies, to see if they watch a video and then come back to purchase at a later date. This is known as an “assisted conversion." Different attribution models are then used to determine how much won revenue should be applied to each session and interaction.
There’s not an inherent problem with measuring conversions and assists in this way. In fact, especially for product, onboarding, and sales videos, it makes complete sense to track this metric and use it to justify further investment. The problems arise, however, when you rely on conversion for all videos, as your sole KPI.
Doing so is essentially saying that the main job of each video you create is to drive conversion, or in other words, every video is a product or sales video. But video, self-evidently, can be so much more than this. What if someone watches my video, talks about my brand in a private Slack group, and then a contact of theirs visits my website to become a customer?

To many, this would register as a non-converting video viewer, followed by a direct or organic conversion, with the video having contributed nothing to the result. In reality, the video that was shared in this instance was the marketing touchpoint that made all the difference.
Clearly this is an issue, but the main problem with conversion-only measurement is what it does to the creative process. If you measure every video like a product video, you end up making only product videos. Learning videos, intended to simply educate potential customers, end up trying to sell the virtues of the your product. This leaves you with content that feels overly self-promotional, which quickly turns audiences off.
“The main problem with conversion-only measurement is what it does to the creative process.”
Similarly, ads for social media, intended to engage audiences and raise brand awareness, end up trying to explain detailed product value propositions. And you can guess what happens next—your audiences tunes out.
The paradox presented here is clear; the focus on conversion actually prevents companies from creating great videos, which negatively affects conversions.
Error 2: Measuring only impressions
Impression-based measurement is an attempt to determine how many people your videos has reached, such that one can calculate market penetration and brand awareness. This involves capturing the “view” and “impression” metrics from all the video distribution platforms available, and aggregating them to get a sense of the amount of people reached.
The least sophisticated method of doing this is to track the number of impressions (users exposed to the video), and then divide this by distribution spend to determine CPM (cost per thousand impressions).
More sophisticated methods involve discounting impressions which did not lead to a view of a certain quality threshold (e.g. watching more than 10 seconds of the video), and then tracking the number of “Engaged views” across all platforms.
There’s not an inherent problem with measuring views in this way. In fact, especially in competitive markets, having a proxy for “reach” can be very important. The problems arise with this methodology when impressions become your sole KPI. Doing so is essentially saying that the main job of each video is to generate reach—every video should be as shareable and immediately engaging as possible.
Video can serve a much greater purpose than simply grabbing attention on social media. If a relatively small number of people watch a video that contains a strong brand or product message, is this less valuable than a large number of people watching something frivolous? With this mindset, the following would classify as Wistia’s most successful marketing video to date.
If you measure every video like a viral social video, you only make viral social videos. Lots and lots of short videos, all with catchy hooks. Learning videos, intended to simply educate potential customers, become unnecessarily short, with a disingenuous hook for the sake of maximizing average percentage watched and view counts, making them feel shallow.
“Learning videos become unnecessarily short, with a disingenuous hook for the sake of maximizing average percentage watched and view counts, making them feel shallow.”
Ads for social media, intended to engage audiences and raise brand awareness, end up sacrificing brand message to hit whatever will appeal to the greatest number of people, which fails to generate truly meaningful brand impressions.
Paradoxically, the focus on impressions ensures fewer people are actually impressed.
The Universal Metric: Time Watched
The world is becoming more connected and simultaneously more private at the same time. We're subjected to a constant stream of advertising noise across the web, and yet have better and better tools to find exactly what we’re looking for from the people we trust most.
This means word of mouth is becoming the most important and preferred means of influencing purchasing decisions for individuals and companies alike. And this is why “Time Watched” is a great KPI for the vast majority of videos—it prevents us from caring only about people who purchase and people who engage with our content, however insignificant the impact is for them.
To prove the point, let’s compare Assisted Conversions, Engaged Views, and Time Watched for three different Wistia videos over comparable, but different months. We'll be looking at:
- A product video on one of our product pages (The Wistia Video Player)
- A video that went viral on social media (How to Collaborate Remotely on a Video Shoot)
- The first episode of our original series (One, Ten, One Hundred)
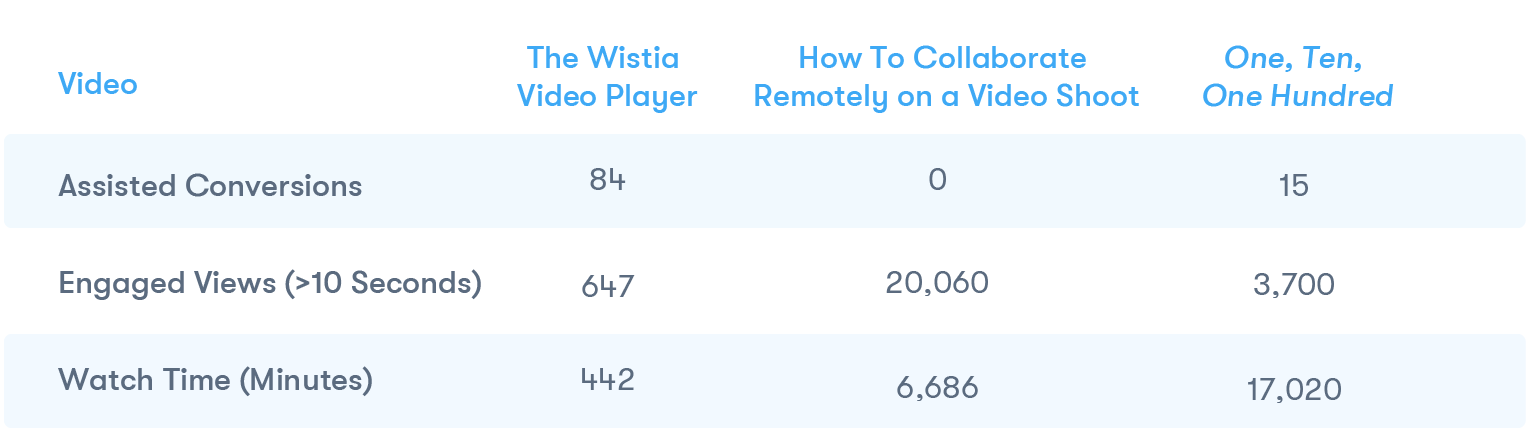
Most marketers will look at these numbers and think “The product video is clearly the most valuable one, you just need to find a way to get that in front of more people...”, but I’d urge you to leave your measurement biases aside for one moment and take a wider view.
Intuition should tell you that the long-form original series video is the best and most valuable piece of content marketing out of these three. Surely, 3,700 people watching most of a 10-minute video is more beneficial than 20,000 people watching a 20 second snippet each. And you can also surmise that many of the conversions attributable to the product video are because of its position in the funnel, rather than its absolute value.
“Intuition should tell you that the long-form original series video is the best and most valuable piece of content marketing out of these three.”
In these cases, we saw a much bigger increase in both branded search volume and absolute number of conversions following the launch of our long-form video series, than we did with the short viral success or the new product video.
This is almost certainly because it had a much bigger impact on our existing customers, potential customers, and influencers, but only ‘Time Watched’ gives us a good sense of this as a comparable video metric.
Focusing on Time Watched has an added benefit of encouraging you to create better content:
- A focus on Conversions tells you that product videos are the best, and you should make more of them.
- A focus on Impressions tells you that you should create more short-form, entertaining videos that aren’t tied to your brand story.
- A focus on Time Watched tells you to focus on the things that your audience has meaningfully, voluntarily engaged with.
What Time Watched means for marketers
Admittedly, Time Watched has problems of its own. For starters, it extrapolates from a concrete sense of “people impacted” to a more abstract number, “content consumed." Where I can imagine X number of people watching a video or Y percentage of those people converted, it’s much harder to mentally visualize consumption.
It’s also, intentionally, not a metric that can be seen through the lens of “ROI,” or tied to a typical conversion funnel. But, in the modern digital world, where interactions with your brand are happening more on big media platforms and within walled gardens, funnel-based measurement tells an increasingly inaccurate story.
The great value of Time Watched for those trying to justify investment in video, is that it’s a metric that can be used to compare different media types. If I can show that 500 hours were spent reading 20 blog posts, but 700 hours were spent watching just 5 videos, it makes the case for shifting from investment in text and images to videos much easier.
If we can grasp the concept that, as marketers, we are no longer optimizing for share of voice, (i.e. the amount of noise being made) but for share of mind (i.e. the time and consideration people are spending with your company), Time Watched reveals itself as the best possible universal video metric.
The Wistia Guide to Video Marketing
From building a comprehensive strategy, to getting the most out of your video content, start marketing your videos today!
Let’s go →