


Introduction
At Wistia, we examine the viewing data for each video we release, paying particular attention to the video's engagement. At the highest level, this data tells us whether we did a good job capturing and holding our audience's attention. We use this data to help guide improvements for our next video. Occasionally, we'll even re-edit and republish a video based on this information.
Engagement: The percentage of your video that your viewers watched
The overall engagement number for a video is a helpful starting point, but that number alone doesn't give us a ton of insight into exactly how we can improve our future efforts. One way to understand video data more clearly is to divide your video into pieces and evaluate how each section performed individually. Let's explore:
 Video engagement rarely looks like this
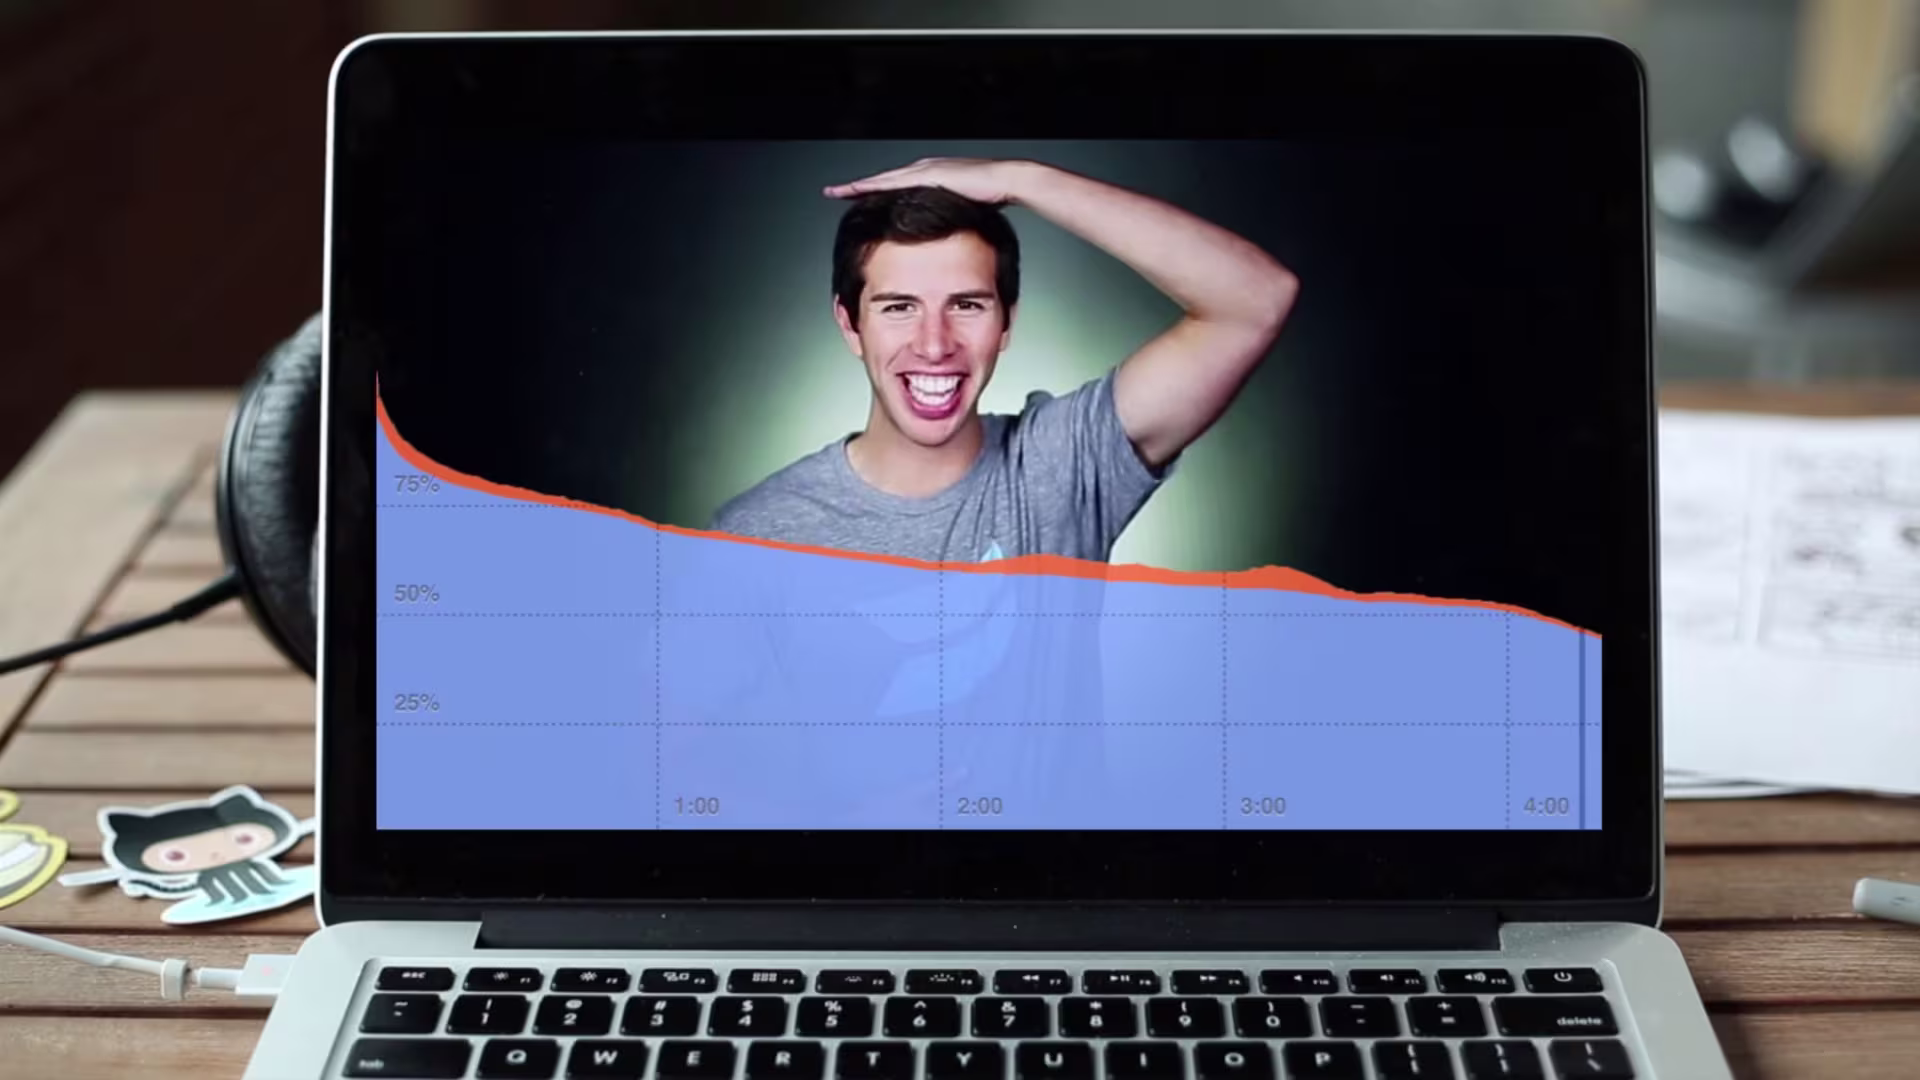
 Instead, a typical engagement graph looks more like this
Looking at the engagement graph on the right, we see that there is a large drop in engagement at the very beginning of the video, a steady drop over the middle section, and then another inflection point at the end. This is pretty typical.
Analyzing these three sections independently can help us better understand our overall viewer engagement and, more importantly, highlight actionable steps to improve the next video we make.
Case Study: Making Better Help Videos
To illustrate the nose-body-tail framework, we're going to analyze the data for a video from our Learning Center.
The Nose
In this analysis, we define the nose as the first 2% of your video.
If your engagement drops during the nose section, this tells you that some people were immediately disinterested in your content. There could be lots of reasons for this, but the main takeaway is that the video failed to hook someone who showed enough interest to click play.
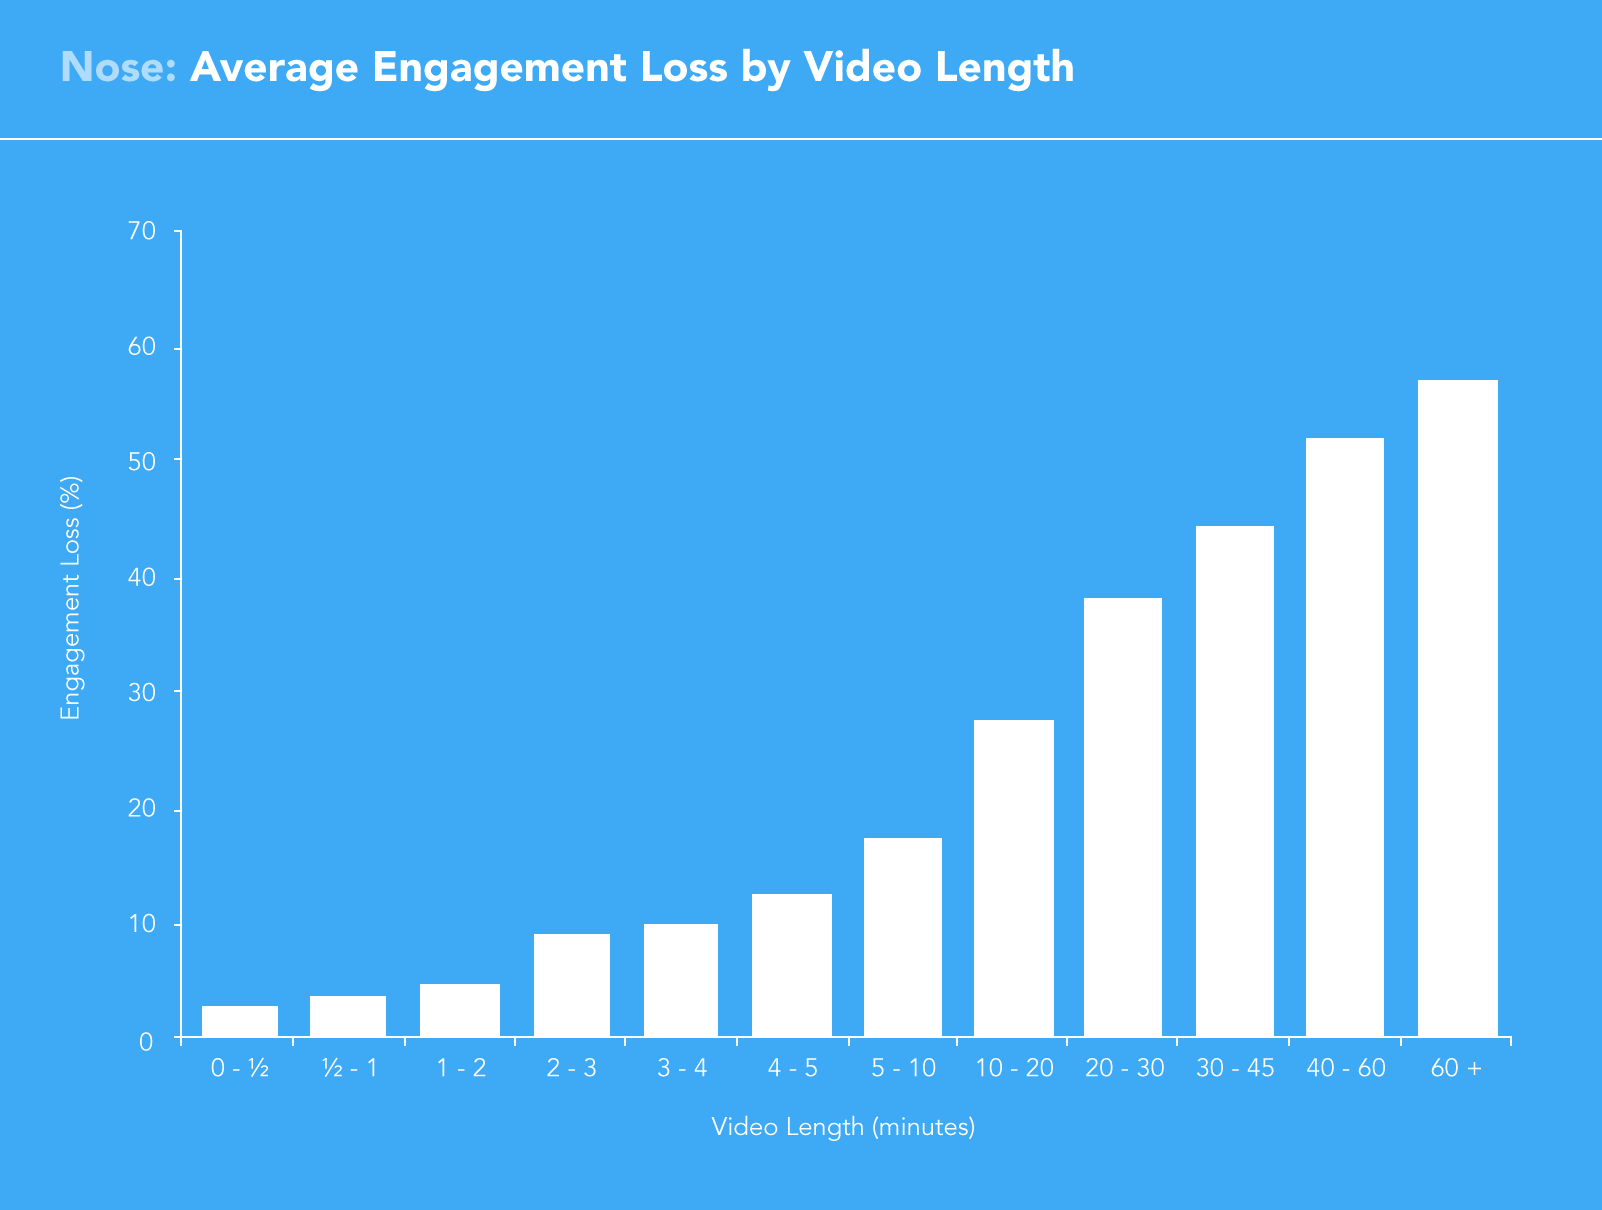
The "average" engagement loss in the nose is highly correlated with video length. Analyzing a large sample of all Wistia-hosted videos, we see that the average engagement drop in the nose is 4.9% for videos 1 - 2 minutes in length. That engagement loss increases to 17.3% for videos 5 - 10 minutes in length. This data gives us a rough benchmark to evaluate the nose of our videos.
Remedies for nose engagement drop:
- Abbreviate the introduction to the material. Get to the point, already!
- Make sure your audio is audible and clear.
- Experiment with removing intro graphics and logo sequences, especially if people are likely to watch a bunch of videos in succession.
- Hook your audience by showing and proving your point, rather than just stating it.
- Avoid talking about yourself too much. Instead, the page the video lives on can help set context for the video.
The Nose: Making Better Help Videos
Now we'll take a look at the nose of the "Making Better Help Videos" engagement graph.
The Body
The body is the middle 96% - the meat of your video.
Engagement drop during the body is often the most dangerous of all. A viewer who leaves during the body is telling us, "I was interested at first, but then you bored me." What's even worse is that a viewer who we disappointed at this stage may be less likely to watch any of our future videos.
Engagement drop could also be an indication that viewers have found the information they were looking for and are now satisfied. You have to look at your specific video to evaluate which interpretation is most likely.
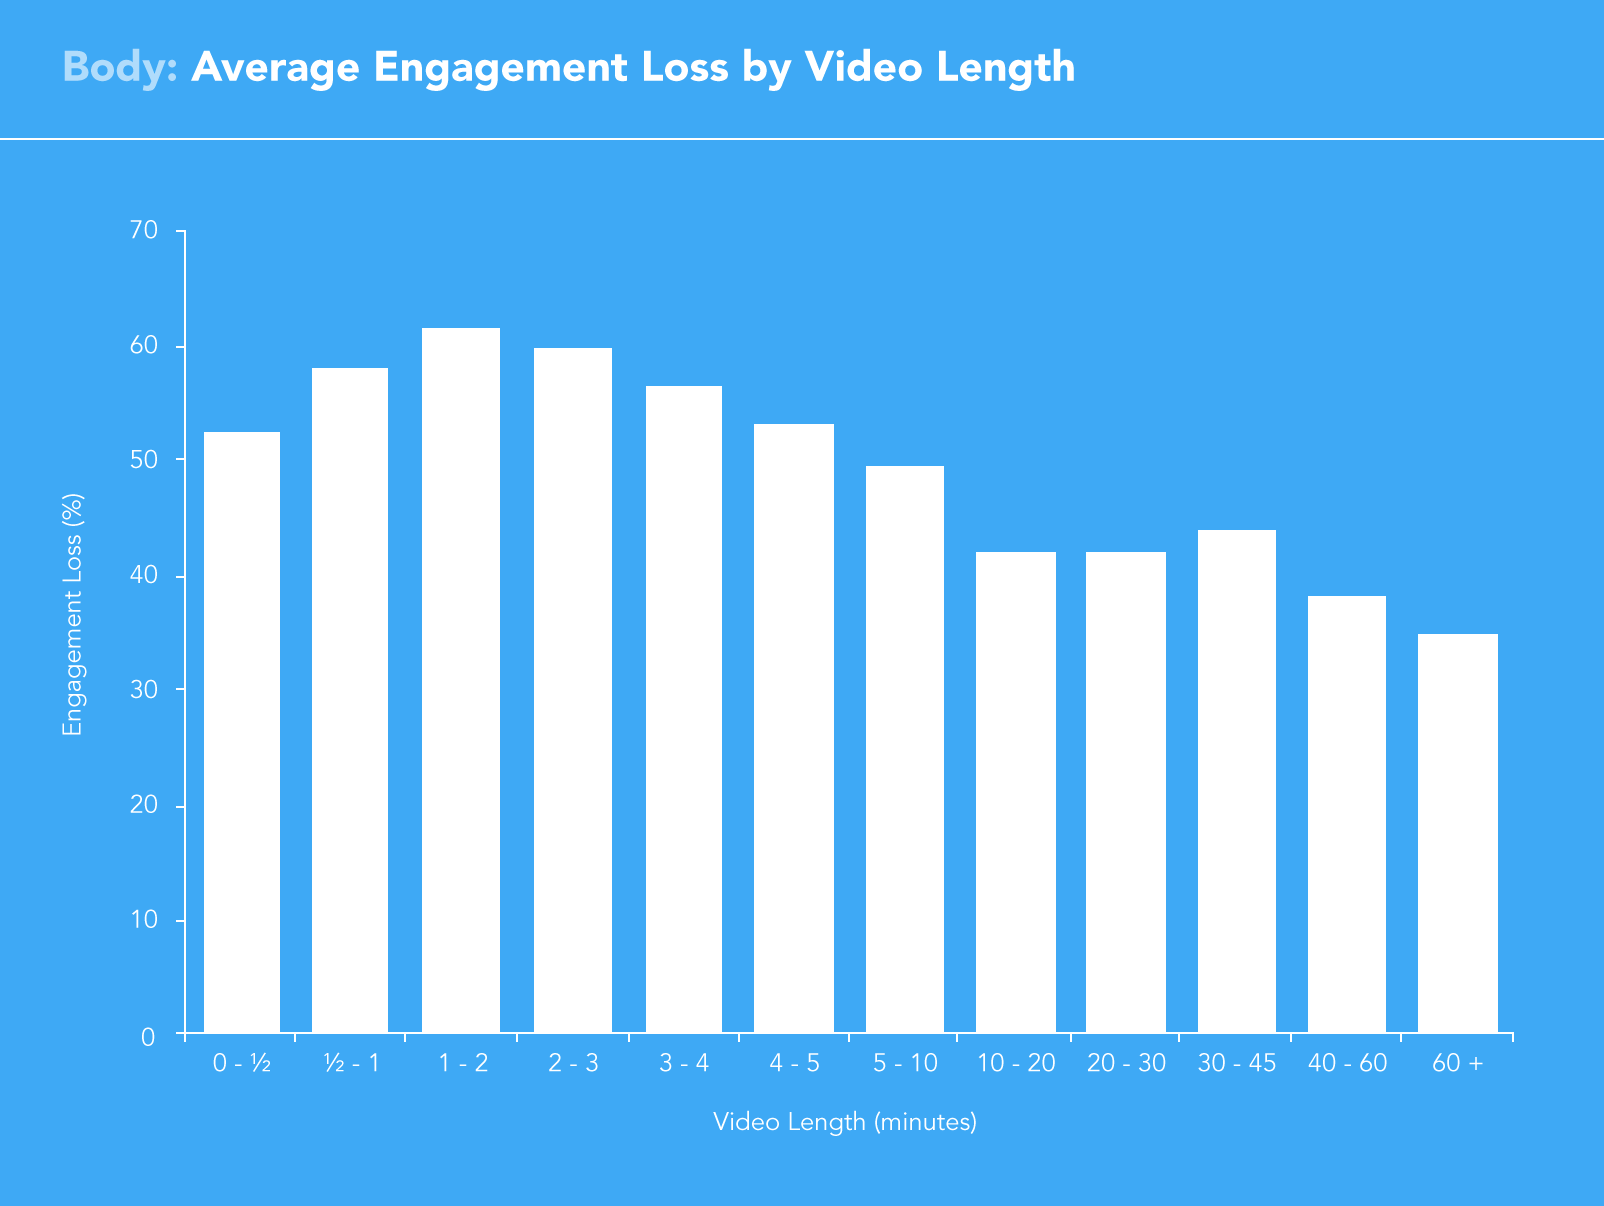
Video length can influence engagement drop in the body, but we see this far less than we do in the nose. Below, we can see the average engagement drop for videos of various lengths. Again, this gives us a rough idea of how our video compares to others of similar length (a truly fair comparison requires analysis of a number of other factors including type of video, location on page, industry, etc.).
Remedies for body engagement drop:
- Consider splitting the body into multiple videos.
- If the concept allows for it, use different shooting locations to break up the monotony.
- Think about adding comedic or human elements to longer sections.
- Remove section title cards. This will force you to tighten your section transitions and will make the video feel shorter.
- Try adding another person to the script. Sometimes the flow of a video is better with two people speaking lines back and forth.
- The right music can help drive the video and move the video along, keeping it from feeling stale.
The Body: Making Better Help Videos
The Tail
The tail is the final 2% of your video, generally where things are wrapping up.
Engagement drop in the tail is something to pay attention to if you have a call to action of any sort at the end of the video, and far less important if you don't. It's natural to end our videos with a summary of the information presented, a change in music, and possibly an animation of our logo. But those things are a clear signal to the viewer that the "valuable" content is finished, and we often see a noticeable drop-off here.
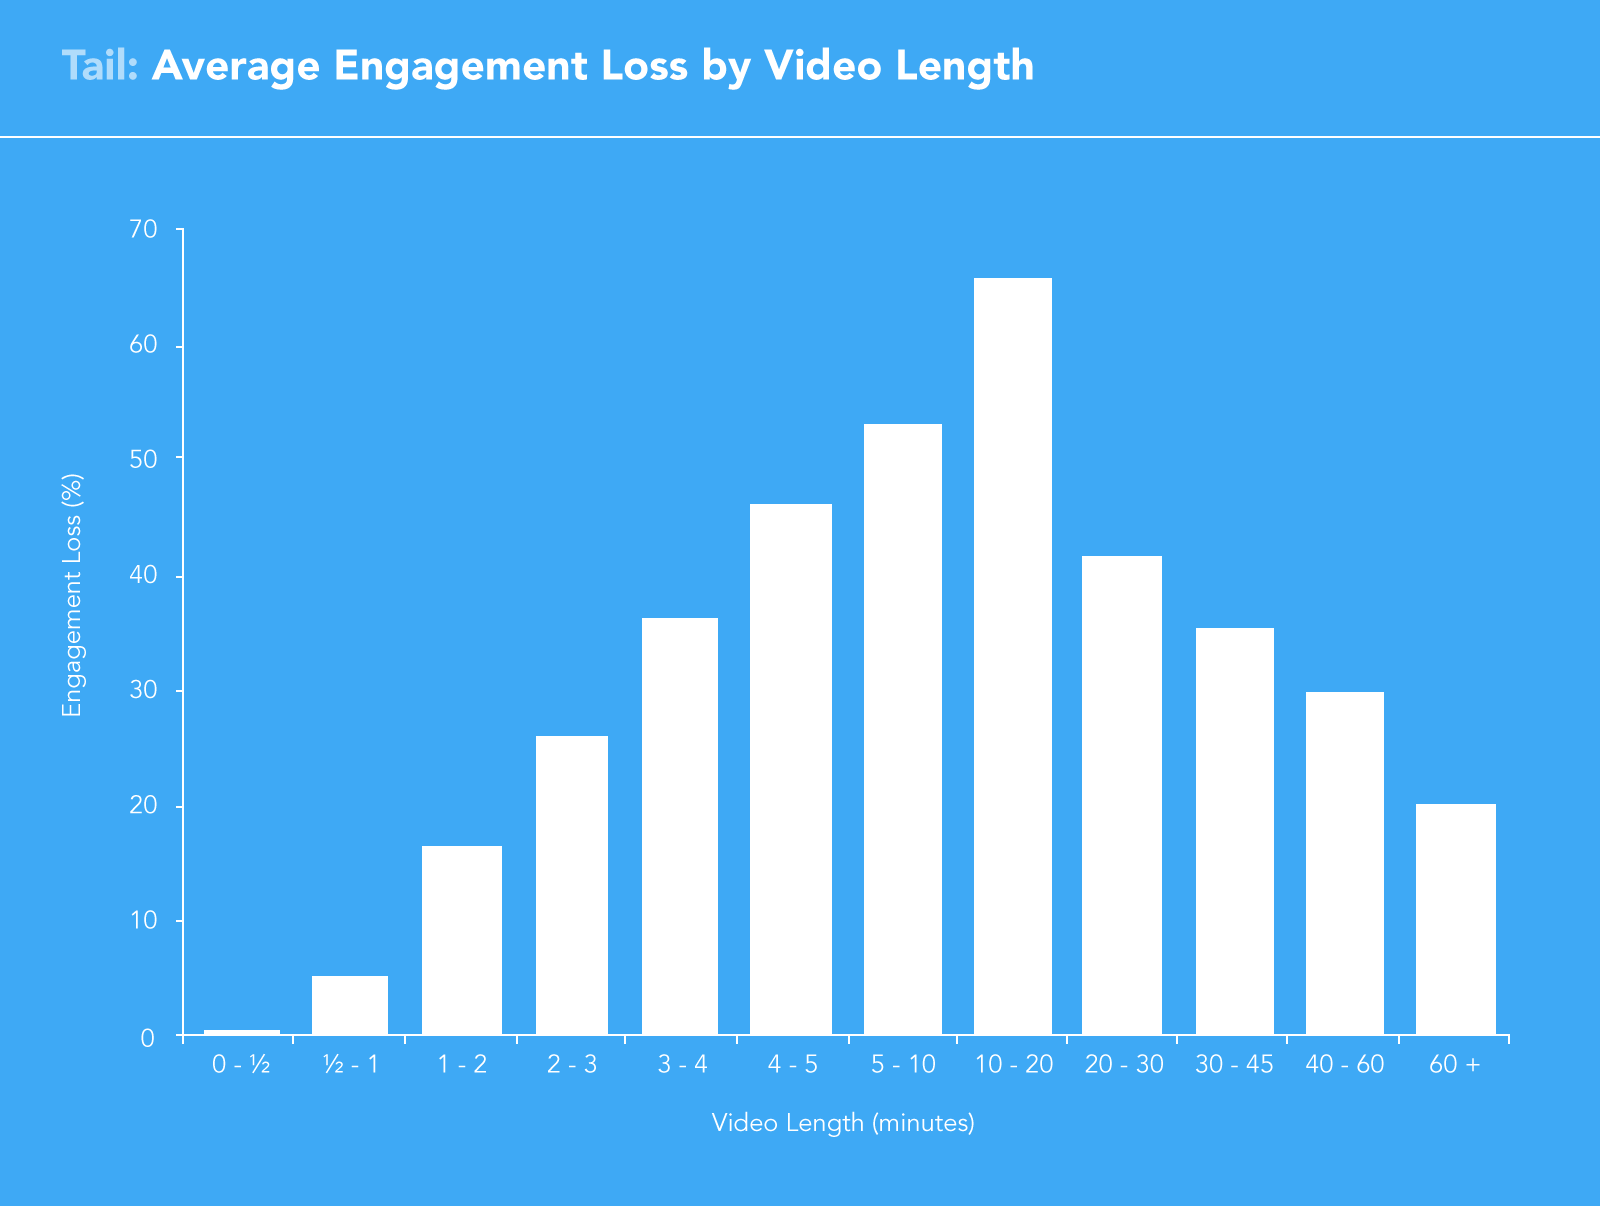
In terms of video length, engagement loss in the tail section follows an interesting pattern. We see the highest drop-off for videos 10 - 20 minutes in length, and progressively less loss on either side of this peak.
Remedies for tail engagement drop:
- Don't use phrases like "in summary," "that’s about it," or "to wrap things up." This is an indicator that the good information is over.
- Avoid recapping everything you just said. The viewer can re-watch the video if they want to hear any information again.
- Watch out for how long your logo is on screen at the end of the video. Use a short logo at the end of the video, so that any calls to action or email collectors come up as soon as the video truly ends.
- Watch out for music that clearly indicates the song is wrapping up and the video is about to end.
The Tail: Making Better Help Videos
Putting the Sections Together
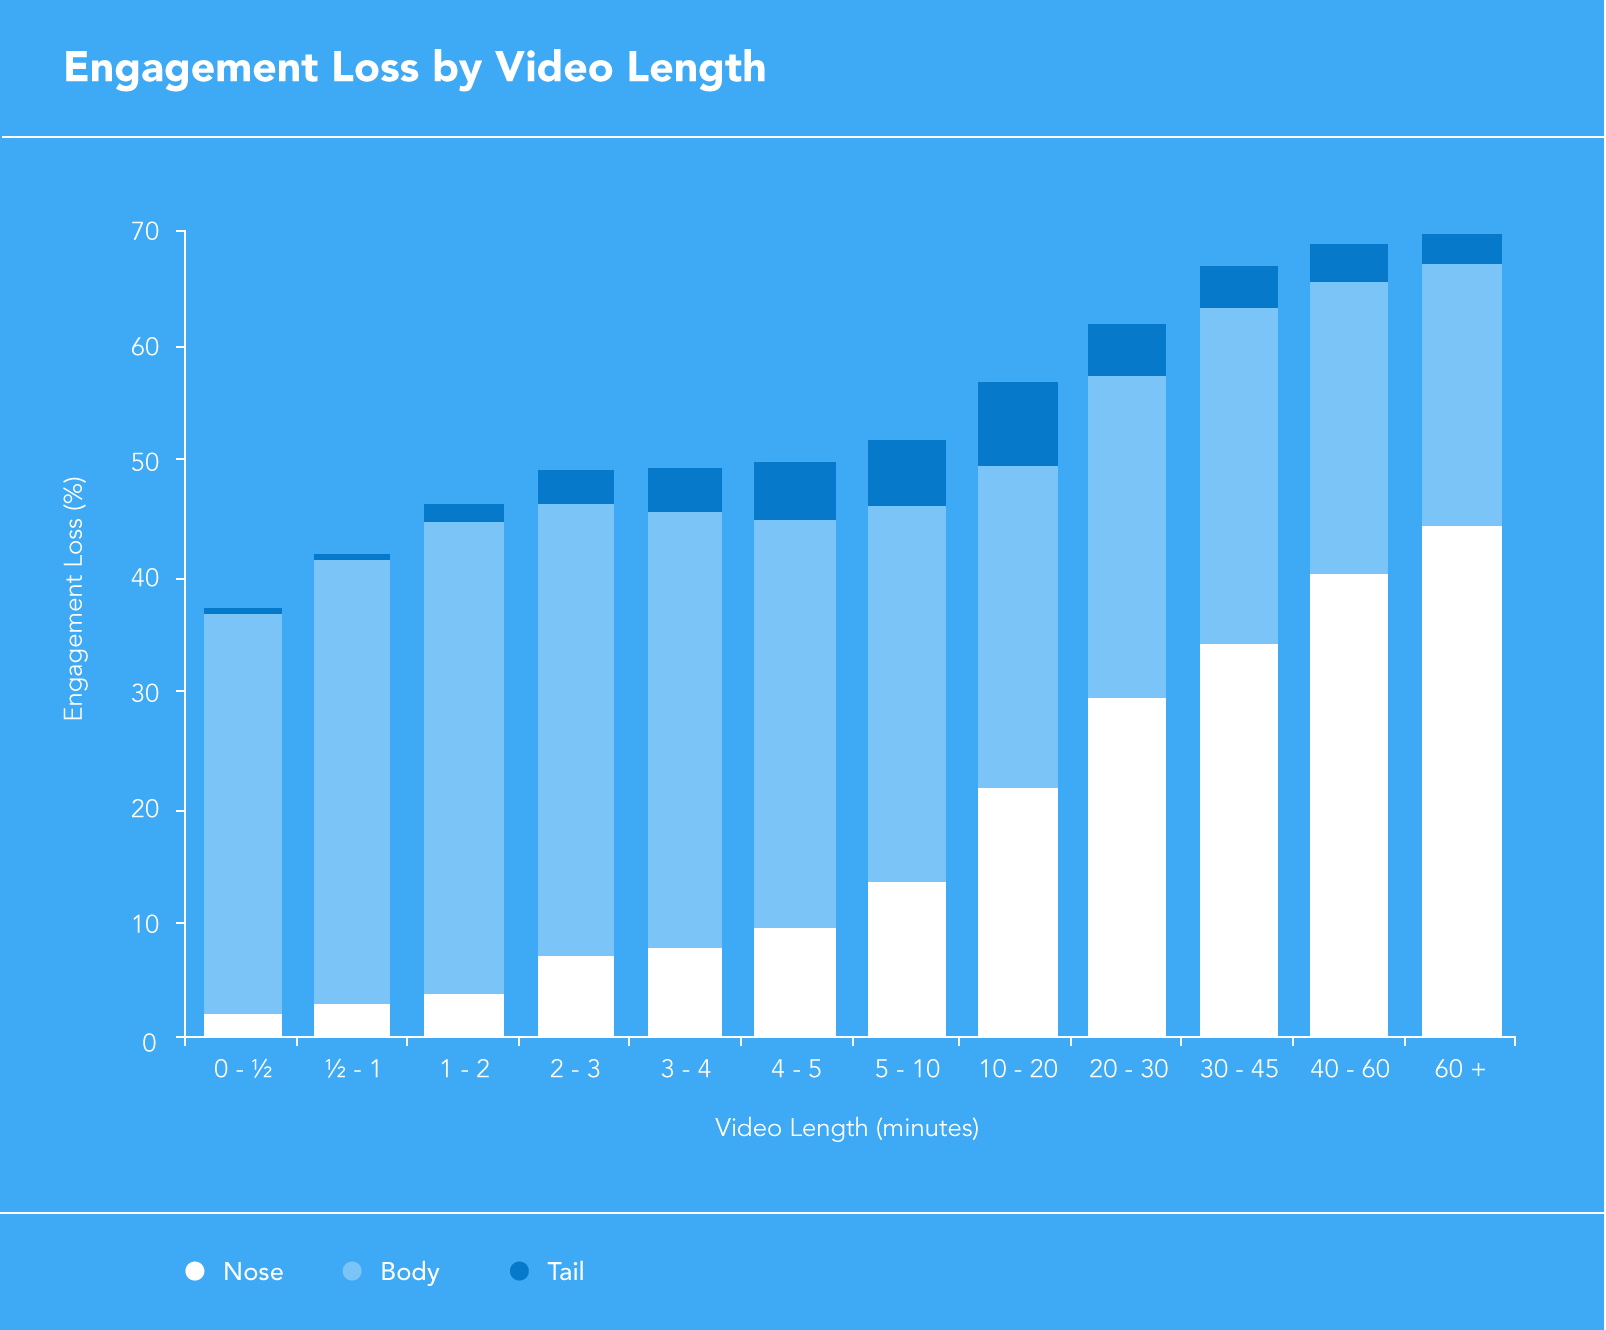
Looking at the sections of a video in isolation is helpful. However, don't forget to put it all together and examine how each section affects overall engagement. Not surprisingly, engagement loss in the body – the longest portion of the video – accounts for a large portion of the total engagement loss for most videos.
Interestingly, as video length increases, the nose becomes a larger and larger factor. Part of this is certainly because 2% of a 45-minute video is longer in absolute time than 2% of a 1-minute video. There's also way more pressure on the nose of a longer video. I can see that I have a long video ahead of me, so if you don't win me early, you're not going to keep me.
Conclusion
Overall engagement is a valuable video metric, but translating that number into actionable steps can often be tricky. Analyzing videos in three parts—the nose, tail, and body—helps us make more sense of our data and guides us on how to make our next video even better than our last.
Business Video Fundamentals
Not sure where to begin or need a video strategy refresher? Learn how to concept, produce, measure, and utilize video with our 5-day email course!
Let’s go →