The Top 13 Webinar Analytics For Measuring Success
Use these insights to refine your strategy and make each webinar a bigger win than the last.
Webinars ranked as the second most impactful type of video content in our research for the 2026 State of Video Report. So, how is webinar impact measured?
Think of webinar metrics as feedback you get from a trusted friend. They tell you what you’re doing well and where you can improve. You can use these insights to refine your strategy and make each webinar a bigger win than the last.
With so many metrics out there, it can be hard to know which ones matter. That’s why we rounded up 13 of the most important metrics to track before, during, and after your live event. And guess what? When you host webinars in Wistia, you you can track them all in one place! Let’s take a look!
Pre-webinar metrics
Success starts long before you go live! Track your registration and promotion metrics in the weeks leading up to your online event. This way, you’ll get the insights you need to improve your promotion strategy in real time and get more sign-ups.
Here’s what to track:
1. Number of registrants
Watching registrations roll in can feel like seeing the guest list fill up for a party––it’s exciting! This is your first glimpse into how well your promotional efforts are working.
To keep the momentum going, try spreading the word through different channels (here are five prime spots to consider) — and keep promoting your webinar until the big day!
After the curtain falls on your webinar, you’ll use the number of registrants to calculate the attendance rate (more on this later).
2. Registration page conversion rate
A killer promotional strategy may drive a ton of folks to your webinar registration page, but the page has to convince them to sign up for your event. That’s why you need to pay attention to the percentage of page visitors who registered for your event.
If this metric is low, it’s time to revamp your registration page to make sure it’s engaging enough and that it covers all the important details. You want your registration page to have:
- A compelling webinar description
- A biography and image for each host
- A registration form
- Brand-enhancing graphics (like custom illustrations)
The registration form also plays a big role in the conversion rate. If it asks for too many details, some page visitors may bounce. So if you can customize the form, keep it short and sweet.
Stick to the basics: first name, last name, and email. Make things like phone number, company name, job title, and country optional — or skip them entirely.
3. Registration rate by channel
When you’re spreading the word about your webinar across different platforms, keep track of how many registrations each channel brings in. This way, you’ll uncover which channels are your top performers and you can focus on them to maximize your reach and number of registrations.
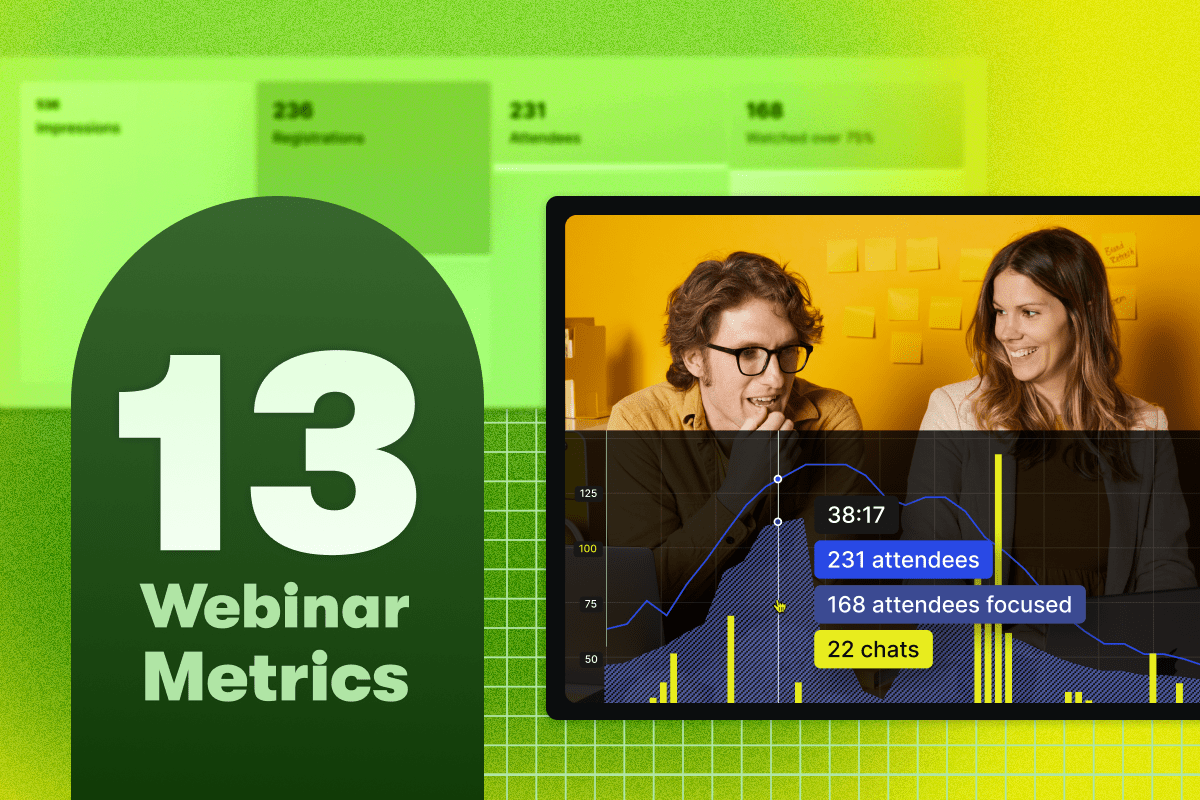
In Wistia, you can track impressions, registrations, and registration rates, along with detailed referral insights and UTM analytics. Additionally, registration analytics in Wistia now include post-webinar registration data, with a clear distinction between pre- and post-webinar registrants, for webinars created after July 24, 2025.
Registration analytics also display company logos so you can instantly spot which businesses attended your webinar. After the event, filter by company to plan follow-up and measure account-level engagement.
Live webinar metrics
If you thought hitting the “go live” button meant a break from numbers, think again! Your audience’s behavior will show how engaging your event actually is. Here are the metrics to watch when you’re live:
4. Focused attendee rate
This metric shows you the amount of attendees who are actually paying attention to your presentation. The way this is measured varies between webinar platforms.
It shows how engaging and valuable your audience thinks your content is. If you notice a drop in this number, try spicing up your presentation or adding interactive elements.
Wistia tracks how many attendees have your live event browser tab open and visible on their screen. Our attendee analytics also include heatmaps for individual viewers and track how engagement shifts throughout the webinar, including watch time and chat activity.
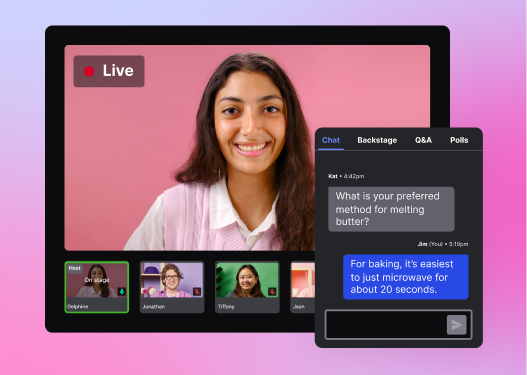
5. Chat participation rate
Engagement is good, but active engagement is even better. You can see how actively engaged your audience is by tracking how frequently they send messages in the chat.
A high chat participation rate means your content is sparking interest and discussion. If the chat is quiet, try asking open-ended questions or encouraging your audience to share their thoughts and experiences.
6. Attendee drop-off
By paying attention to when your attendees leave and identifying the most common drop-off points, you’ll get the insights you need to tweak the content and format of your future events to make them more engaging.
Let’s say your attendees usually leave during the question and answer (Q&A) session. It’s a clear sign that Q&A isn’t engaging enough for them, and you’ll want to figure out what’s making them leave (maybe the answers are too long-winded) and explore ways to improve your Q&As at future events.
7. Audience responses
While audience responses aren’t a tangible metric, they’re still a valuable way to gauge your audience’s interest in your presentation. You can use polls and questions to measure this.
Let’s say the goal of your webinar is to get your audience to try your product or new feature. You could poll them at the end of your webinar to see if they want a demo. A “yes” response means your sales team can follow up immediately.
It should go without saying that you should always answer your audience’s questions, but you should also pay close attention to the types of questions they’re asking. This will help you figure out what topics need more clarity and how to better deliver the info.
With Wistia, you can add a post-event redirect URL to automatically send your audience to a survey or link right after the webinar ends to find out more about their thoughts on your presentation.
All-in-one Video Platform
Streamline Your Webinar Process
Post-webinar metrics
Once your webinar wraps up, it’s time to ask the big question: Was it worth all the hard work? To get your answer, look at these metrics:
8. Webinar attendance rate
After your event, you’ll have two groups of registrants: those who attended the live event and those who registered but didn’t show up.
You can use these two numbers to calculate your attendance rate, which is the percentage of total registrants who attended the live event. Most webinar platforms will calculate this metric for you.
Your attendance rate shows how well you’re engaging registrants before the event. It also helps you decide how often to schedule webinars and which topics interest your audience.
So how do you know if your attendance rate is good enough? According to our platform data, if it’s between 30–40%, you’re doing fine. While industry benchmarks are a good starting point, the real value comes from comparing them to your own data.
Track your attendance rate monthly. See how different topics and webinar frequencies affect your audience size. We’ve found that smaller, targeted webinars like product demos tend to have higher attendance than large thought-leadership events. Assess your promotional efforts — are you sending too many or too few reminders? Look for trends, like which topics draw better attendance.
In Wistia, you can also see exactly how replays perform, right alongside live webinar analytics. This complete view of your webinar’s performance makes it easier to track ROI and lets you plan future webinars with more confidence.
9. Webinar lead generation
If the goal of your webinar is to help your sales team close more deals, focus on the number and quality of the leads you get before and during the event. This will show if you’re attracting the right people. Your sales team can help with this. Look for these types of leads:
- Marketing qualified leads (MQL)
- Sales qualified leads (SQL)
- Sales qualified opportunities
- Closed won/closed loss
If you didn’t get enough quality leads, think about what topics will attract the right audience and start hosting those webinars. For example, if you want people to sign up for a demo, host a webinar that explains how your product works and its benefits to draw in folks who are already interested in your product and want to know more about it.
10. Conversions
The goal of every webinar is to get attendees to take some sort of action. It could be downloading an ebook, adopting a new feature, signing up for a demo, or anything else that would push them through the customer or sales journey.
One of the most straightforward ways to measure the success of your webinar is to see how many attendees took that action. In marketing speak, that’s called tracking conversions.
How you track conversions depends on your webinar and marketing goals. For example, if you’re raising brand awareness, you may track how many attendees downloaded your latest guide. If you’re aiming to increase sales, you might track the number of free trials your attendees signed up for.
If your conversions are below your expectations, revisit your webinar strategy and identify different ways to improve it. You could try refining your call to action, enhancing your presentation content, or better targeting your audience.
11. Brand awareness
While brand awareness isn’t a number you can measure, it’s still a great way to understand your event’s overall impact.
Go on social media to see how your webinar boosted awareness of your brand. Did you get new followers? What are folks saying on your posts about the webinar? How much engagement are those posts getting?
On-demand webinar metrics
Recording your webinars and turning them into evergreen on-demand content is a great way to grow your audience and generate more leads long after the event’s over.
Over time, your on-demand recording can potentially get more views than the live event. According to our platform data, a third of webinars are still pulling in plays three months after the live event, and 60% of marketers turn their webinars into on-demand recordings hosted on landing pages.
There are many different ways to get people to watch your on-demand webinar. A few ideas: Include it in a follow-up email to your registrants, repurpose it into a different piece of content and link to the full recording, or create a dedicated landing page. Nearly 90% of marketers repurpose webinar content into blog posts, social clips, email campaigns, and more. For more repurposing tips and ideas, check out our Video Repurposing Cookbook!
Whatever you end up doing, you’ll want to see how well the recording does. Here are the key metrics to track:
12. Form submissions
You can gate your webinar recording with a lead capture form to collect the names and email addresses of folks who want to watch it.
This way, you can track their viewing activity and see which viewers are most likely to convert. It’s up to you and your sales team to decide who makes a good lead. For example, your sales team could follow up with those who watch 50% or more of the recording.
13. On-demand audience engagement
Since your on-demand recording is supposed to be evergreen content, you want to make sure that your audience still finds it engaging long after the event is over.
Check the following metrics:
- Play rate: The percentage of page visitors who played the recording
- Call to action (CTA) click-through rate: The percentage of viewers who saw the CTA and took the desired action
- Chapter views: The amount of views each chapter got
If your metrics don’t look good, there are some things you can do to improve them:
- Play rate: Spruce up the thumbnail or change the title and description to make them as eye-catching and relevant as possible.
- CTA click-through rate: Place your CTA at the end of your video. People who watch all the way through are already engaged and more likely to take action. Plus, an interactive feature at the end feels like a natural next step instead of an interruption.
- Chapter views: If a chapter isn’t getting a lot of views, consider cutting it out of the recording or moving it to the end.
Turn webinar analytics into actionable insights
Tracking webinar KPIs (key performance indicators) needs to happen at every stage of the webinar journey. This will help you understand what works for your audience and where you could fine-tune your strategy. And guess what? Wistia offers all these metrics and valuable insights in one place!
